In our exploration of Logging and Metrics tooling, one company/product worth checking out is Datadog. It's been around since 2010 and is one of the larger offerings with over 350 integrations out of the box.
Let's see what it can do on a variety of systems.
Create a Kubernetes Cluster (AKS)
builder@DESKTOP-2SQ9NQM:~$ az aks list
[]
builder@DESKTOP-2SQ9NQM:~$ az group create --name idjaks06rg --location centralus
{
  "id": "/subscriptions/70b42e6a-6faf-4fed-bcec-9f3995b1aca8/resourceGroups/idjaks06rg",
  "location": "centralus",
  "managedBy": null,
  "name": "idjaks06rg",
  "properties": {
    "provisioningState": "Succeeded"
  },
  "tags": null,
  "type": "Microsoft.Resources/resourceGroups"
}
builder@DESKTOP-2SQ9NQM:~$ az ad sp create-for-rbac -n idjaks06sp --skip-assignment --output json > my_dev6_sp.json
Changing "idjaks06sp" to a valid URI of "http://idjaks06sp", which is the required format used for service principal names
We need to check the current versions available to us in Azure
builder@DESKTOP-2SQ9NQM:~$ az aks get-versions --location centralus -o table
KubernetesVersion    Upgrades
-------------------  -----------------------
1.17.3(preview)      None available
1.16.7               1.17.3(preview)
1.15.10              1.16.7
1.15.7               1.15.10, 1.16.7
1.14.8               1.15.7, 1.15.10
1.14.7               1.14.8, 1.15.7, 1.15.10
Now we can create
builder@DESKTOP-2SQ9NQM:~$ export SP_ID=`cat my_dev6_sp.json | jq -r .appId`
builder@DESKTOP-2SQ9NQM:~$ export SP_PW=`cat my_dev6_sp.json | jq -r .password`

builder@DESKTOP-2SQ9NQM:~$ az aks create --resource-group idjaks06rg --name idjaks06 --location centralus --kubernetes-version 1.15.10 --enable-rbac --node-count 3 --enable-cluster-autoscaler --min-count 2 --max-count 5 --generate-ssh-keys --network-plugin azu
re --service-principal $SP_ID --client-secret $SP_PW
Argument 'enable_rbac' has been deprecated and will be removed in a future release. Use '--disable-rbac' instead.
Argument 'enable_rbac' has been deprecated and will be removed in a future release. Use '--disable-rbac' instead.
{
  "aadProfile": null,
  "addonProfiles": null,
  "agentPoolProfiles": [
    {
      "availabilityZones": null,
      "count": 3,
      "enableAutoScaling": true,
      "enableNodePublicIp": null,
      "maxCount": 5,
      "maxPods": 30,
      "minCount": 2,
      "name": "nodepool1",
      "nodeLabels": null,
      "nodeTaints": null,
      "orchestratorVersion": "1.15.10",
      "osDiskSizeGb": 100,
      "osType": "Linux",
      "provisioningState": "Succeeded",
      "scaleSetEvictionPolicy": null,
      "scaleSetPriority": null,
      "tags": null,
      "type": "VirtualMachineScaleSets",
      "vmSize": "Standard_DS2_v2",
      "vnetSubnetId": null
    }
  ],
  "apiServerAccessProfile": null,
  "dnsPrefix": "idjaks06-idjaks06rg-70b42e",
  "enablePodSecurityPolicy": null,
  "enableRbac": true,
  "fqdn": "idjaks06-idjaks06rg-70b42e-6cede587.hcp.centralus.azmk8s.io",
  "id": "/subscriptions/70b42e6a-6faf-4fed-bcec-9f3995b1aca8/resourcegroups/idjaks06rg/providers/Microsoft.ContainerService/managedClusters/idjaks06",
  "identity": null,
  "identityProfile": null,
  "kubernetesVersion": "1.15.10",
  "linuxProfile": {
    "adminUsername": "azureuser",
    "ssh": {
      "publicKeys": [
        {
          "keyData": "ssh-rsa AAAAB3NzaC1yc2EAAAADAQABAAABAQDHZ3iOnMMLkiltuikXSjqudfCHmQvIjBGMOuGk6wedwG8Xai3uv0M/X3Z2LS6Ac8tComKEKg7Zje2KFBnvBJvU5JqkTwNHnmp682tXf15EYgn4tB7MDz5DUARpcUXJbYfUg8yPUDveYHw8PEm1n+1MvLJN0ftvdORG5CQQEl/m7jErbJJQI70xg7C8/HG5GmJpIQjDl7UVsJANKab/2/bbUlG1Sqp4cQ/LwxKxQ6/QK/HVauxDkudoTkFLqukLWVjHvNZD37MC/wygSsEVYF+yrkNJySlNbMk4ZNmMwva1yLX8Shhr8G4wWe8QI9Ska8B0keSIu8fzRWxXAv2gB3xB"
        }
      ]
    }
  },
  "location": "centralus",
  "maxAgentPools": 10,
  "name": "idjaks06",
  "networkProfile": {
    "dnsServiceIp": "10.0.0.10",
    "dockerBridgeCidr": "172.17.0.1/16",
    "loadBalancerProfile": {
      "allocatedOutboundPorts": null,
      "effectiveOutboundIps": [
        {
          "id": "/subscriptions/70b42e6a-6faf-4fed-bcec-9f3995b1aca8/resourceGroups/MC_idjaks06rg_idjaks06_centralus/providers/Microsoft.Network/publicIPAddresses/1fb4eb02-0fb6-49cc-82a9-a3b17faf6a2f",
          "resourceGroup": "MC_idjaks06rg_idjaks06_centralus"
        }
      ],
      "idleTimeoutInMinutes": null,
      "managedOutboundIps": {
        "count": 1
      },
      "outboundIpPrefixes": null,
      "outboundIps": null
    },
    "loadBalancerSku": "Standard",
    "networkPlugin": "azure",
    "networkPolicy": null,
    "outboundType": "loadBalancer",
    "podCidr": null,
    "serviceCidr": "10.0.0.0/16"
  },
  "nodeResourceGroup": "MC_idjaks06rg_idjaks06_centralus",
  "privateFqdn": null,
  "provisioningState": "Succeeded",
  "resourceGroup": "idjaks06rg",
  "servicePrincipalProfile": {
    "clientId": "e6ea5845-0c01-4ccb-854b-70f946aeeccd",
    "secret": null
  },
  "tags": null,
  "type": "Microsoft.ContainerService/ManagedClusters",
  "windowsProfile": {
    "adminPassword": null,
    "adminUsername": "azureuser"
  }
}
We can now see it's been created, then login
builder@DESKTOP-2SQ9NQM:~$ az aks list -o table
Name      Location    ResourceGroup    KubernetesVersion    ProvisioningState    Fqdn
--------  ----------  ---------------  -------------------  -------------------  -----------------------------------------------------------
idjaks06  centralus   idjaks06rg       1.15.10              Succeeded            idjaks06-idjaks06rg-70b42e-6cede587.hcp.centralus.azmk8s.io
builder@DESKTOP-2SQ9NQM:~$ az aks get-credentials -n idjaks06 -g idjaks06rg --admin
Merged "idjaks06-admin" as current context in /home/builder/.kube/config
Next we need to add some content. We'll add an NGinx Ingress controller
builder@DESKTOP-2SQ9NQM:~$ kubectl create namespace ingress-basic
namespace/ingress-basic created
builder@DESKTOP-2SQ9NQM:~$ helm repo add stable https://kubernetes-charts.storage.googleapis.com/
"stable" has been added to your repositories
builder@DESKTOP-2SQ9NQM:~$ helm install nginx-ingress stable/nginx-ingress \
> --namespace ingress-basic \
> --set controller.replicaCount=2 \
> --set controller.nodeSelector."beta\.kubernetes\.io/os"=linux \
> --set defaultBackend.nodeSelector."beta\.kubernetes\.io/os"=linux
NAME: nginx-ingress
LAST DEPLOYED: Mon Apr 13 21:28:21 2020
NAMESPACE: ingress-basic
STATUS: deployed
REVISION: 1
TEST SUITE: None
NOTES:
The nginx-ingress controller has been installed.
It may take a few minutes for the LoadBalancer IP to be available.
You can watch the status by running 'kubectl --namespace ingress-basic get services -o wide -w nginx-ingress-controller'

An example Ingress that makes use of the controller:

  apiVersion: extensions/v1beta1
  kind: Ingress
  metadata:
    annotations:
      kubernetes.io/ingress.class: nginx
    name: example
    namespace: foo
  spec:
    rules:
      - host: www.example.com
        http:
          paths:
            - backend:
                serviceName: exampleService
                servicePort: 80
              path: /
    # This section is only required if TLS is to be enabled for the Ingress
    tls:
        - hosts:
            - www.example.com
          secretName: example-tls

If TLS is enabled for the Ingress, a Secret containing the certificate and key must also be provided:

  apiVersion: v1
  kind: Secret
  metadata:
    name: example-tls
    namespace: foo
  data:
    tls.crt: <base64 encoded cert>
    tls.key: <base64 encoded key>
  type: kubernetes.io/tls


builder@DESKTOP-2SQ9NQM:~$ kubectl get service -l app=nginx-ingress --namespace ingress-basic
NAME                            TYPE           CLUSTER-IP     EXTERNAL-IP     PORT(S)                      AGE
nginx-ingress-controller        LoadBalancer   10.0.140.79    13.89.106.195   80:30160/TCP,443:32342/TCP   92s
nginx-ingress-default-backend   ClusterIP      10.0.234.153   <none>          80/TCP                       92s
Next we can add a sample app and expose it via the ingress
builder@DESKTOP-2SQ9NQM:~$ helm repo add azure-samples https://azure-samples.github.io/helm-charts/
"azure-samples" has been added to your repositories

builder@DESKTOP-2SQ9NQM:~$ helm install aks-helloworld azure-samples/aks-helloworld --namespace ingress-basic
NAME: aks-helloworld
LAST DEPLOYED: Mon Apr 13 21:42:29 2020
NAMESPACE: ingress-basic
STATUS: deployed
REVISION: 1
TEST SUITE: None

builder@DESKTOP-2SQ9NQM:~$ helm install aks-helloworld-two azure-samples/aks-helloworld \
>     --namespace ingress-basic \
>     --set title="AKS Ingress Demo" \
>     --set serviceName="aks-helloworld-two"
NAME: aks-helloworld-two
LAST DEPLOYED: Mon Apr 13 21:43:15 2020
NAMESPACE: ingress-basic
STATUS: deployed
REVISION: 1
TEST SUITE: None


builder@DESKTOP-2SQ9NQM:~$ kubectl apply -f hello-world-ingress.yaml
ingress.extensions/hello-world-ingress unchanged
ingress.extensions/hello-world-ingress-static unchanged
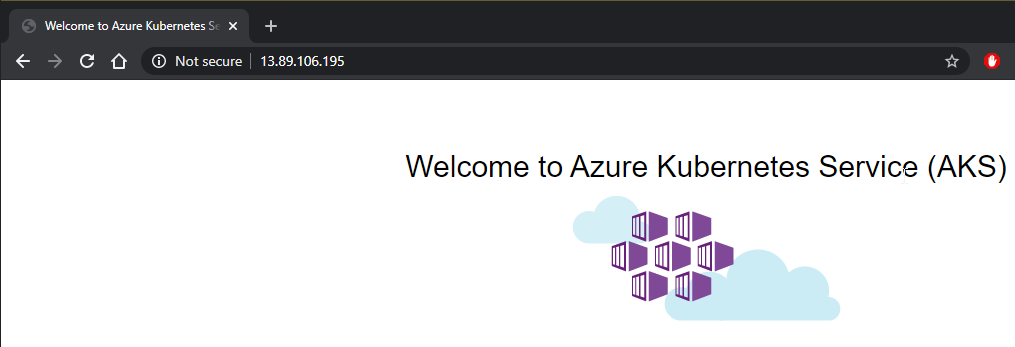
We can verify the app
Installing Datadog
We can use the Helm chart to install it
builder@DESKTOP-2SQ9NQM:~$ helm install idjaks06 --set datadog.apiKey=d7xxxxxxxxxxxxxxxxxxxxxxxxx1d stable/datadog
NAME: idjaks06
LAST DEPLOYED: Mon Apr 13 22:09:52 2020
NAMESPACE: default
STATUS: deployed
REVISION: 1
TEST SUITE: None
NOTES:
Datadog agents are spinning up on each node in your cluster. After a few
minutes, you should see your agents starting in your event stream:
    https://app.datadoghq.com/event/stream
we can immediately see it's working in Datadog
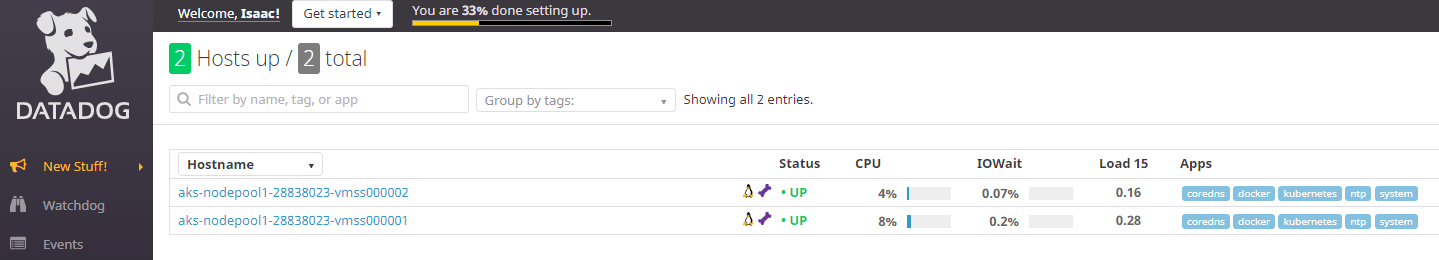
We can look up our Infrastructure List.
We can filter by containers:

This should handle logging
builder@DESKTOP-2SQ9NQM:~$ helm delete idjaks06
release "idjaks06" uninstalled
builder@DESKTOP-2SQ9NQM:~$ helm install idjaks06 --set datadog.apiKey=d7xxxxxxxxxxxxxxxxx21d --set logs.enabled=true --s
et apm.enabled=true --set systemProbe.enabled=true stable/datadog
NAME: idjaks06
LAST DEPLOYED: Mon Apr 13 22:23:51 2020
NAMESPACE: default
STATUS: deployed
REVISION: 1
TEST SUITE: None
NOTES:
Datadog agents are spinning up on each node in your cluster. After a few
minutes, you should see your agents starting in your event stream:
    https://app.datadoghq.com/event/stream
However, try as I might, the helm settings would not enable the logging. So i followed the guide in the logging page to create the yaml and apply it directly
builder@DESKTOP-2SQ9NQM:~$ kubectl create -f datadog-agent.yaml
daemonset.apps/datadog-agent created
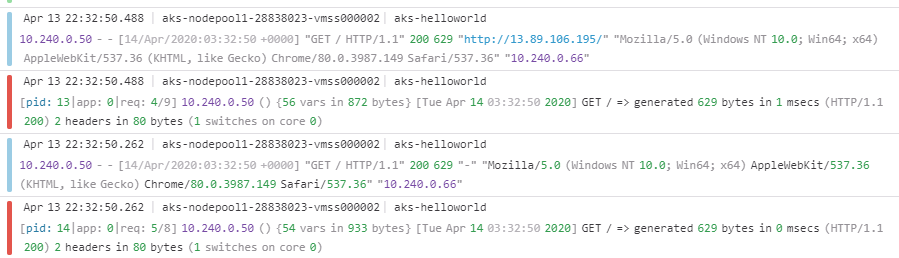
After a few minutes, I could start to see logs rolling in from the ingress-basic namespace that has the helloworld app.
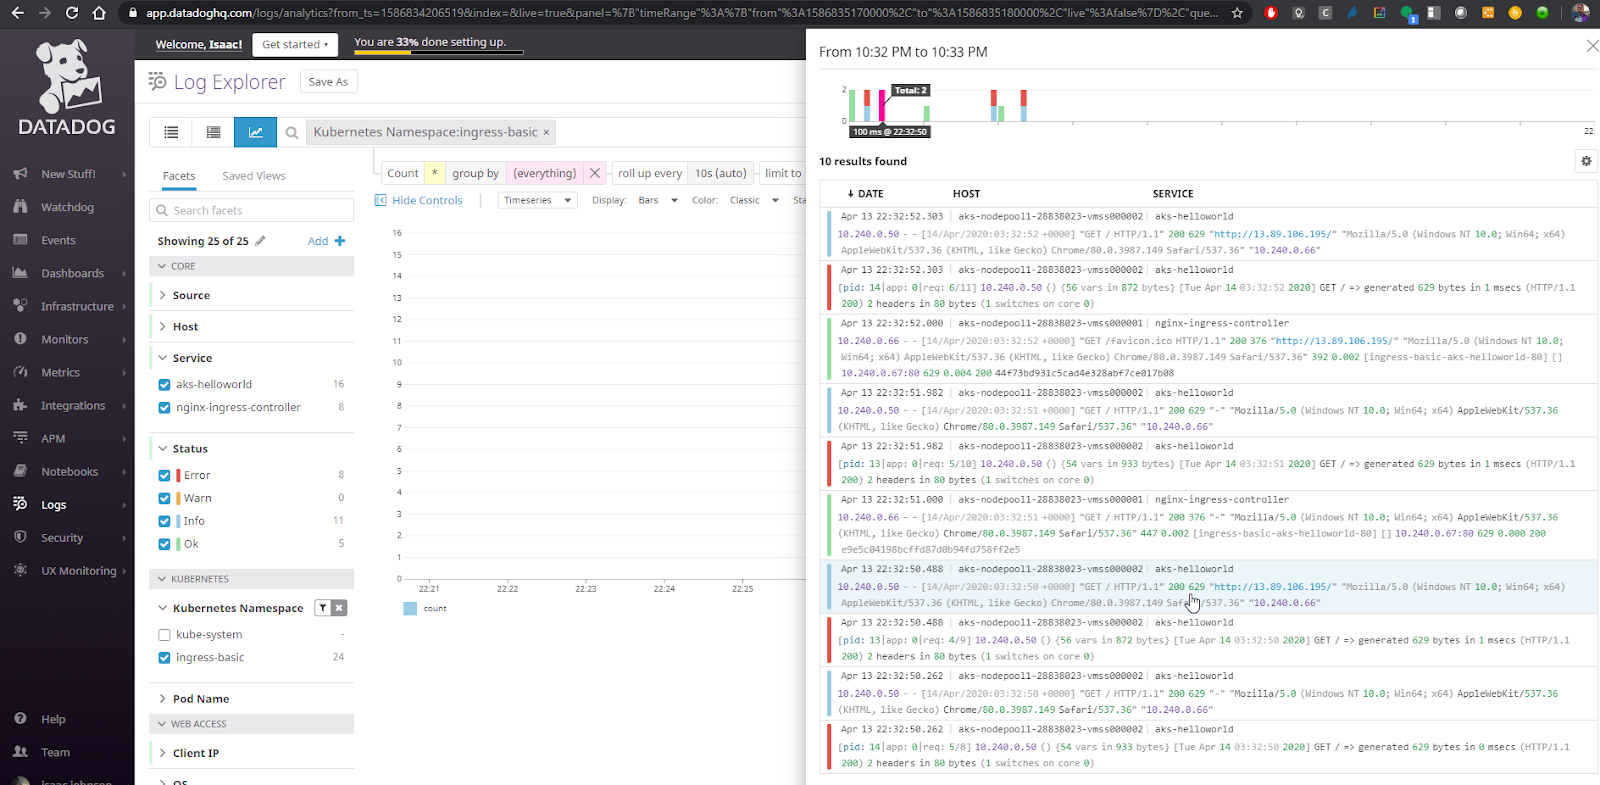
Let’s get a closer look:
I let the cluster and DataDog run three and half days to collect some details. I had a simple unsecured app running. What would DD find?
The first dashboard I want to dig into is the Container Dashboard (“Docker Dashboard”):
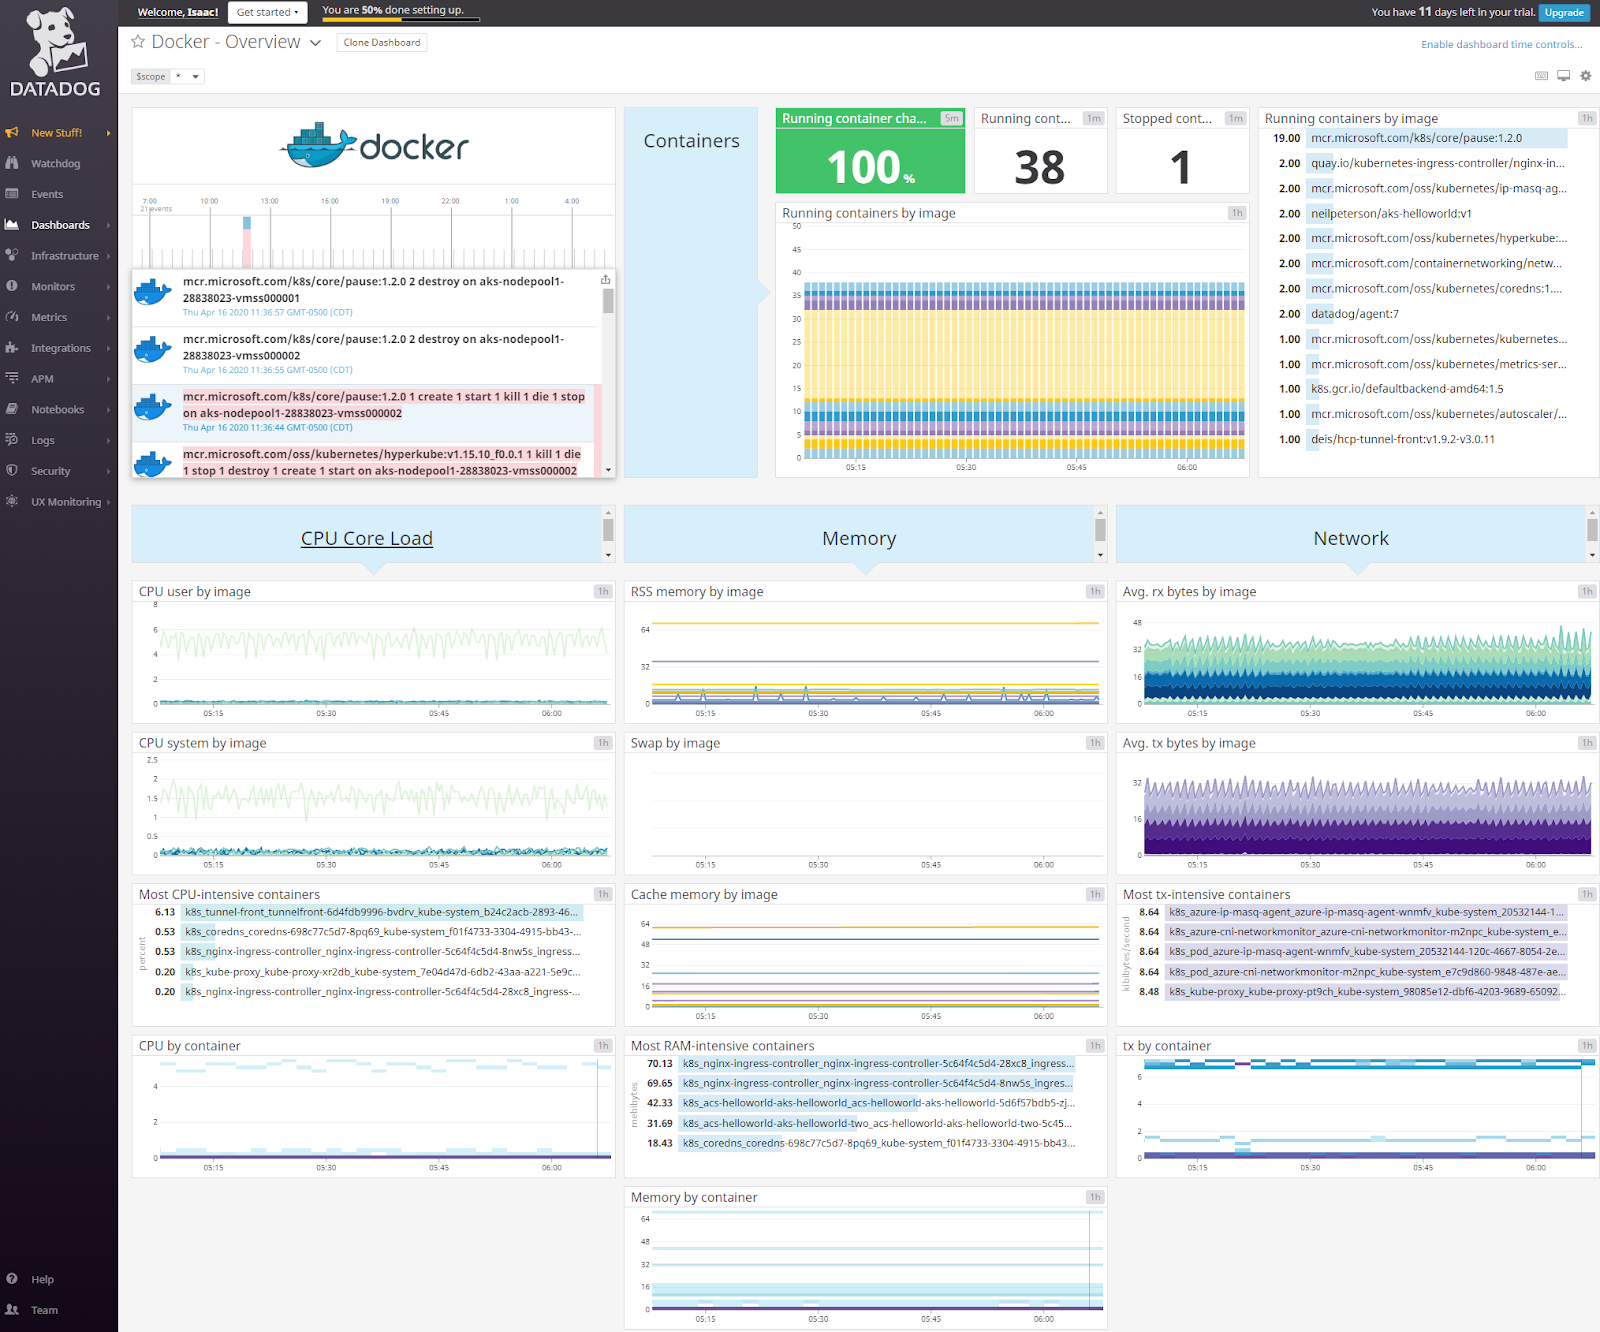
There is a lot to break down.
The midsection shows us our cluster is oversized for our needs. We can see that our largest container, by RAM usage, is NGinx and our CPU never really spikes above 6% by image:

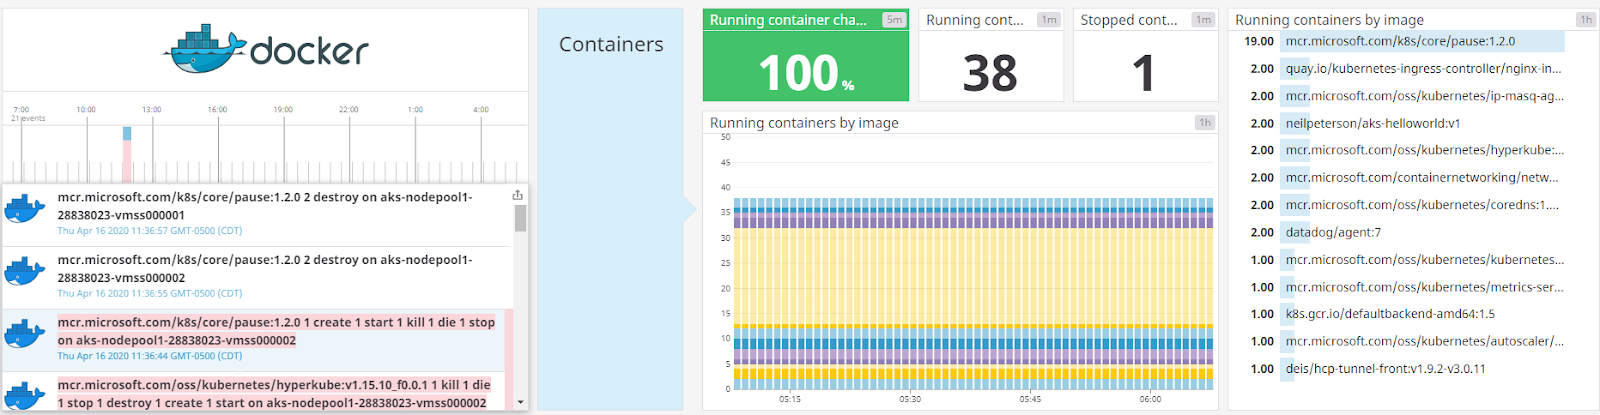
The top half shows us events. All containers are running (nothing hung or scheduled) and of the 38 running containers, most of them (19) are just “Pause” containers. The only events happened yesterday (thursday) when AKS killed some Pause containers:
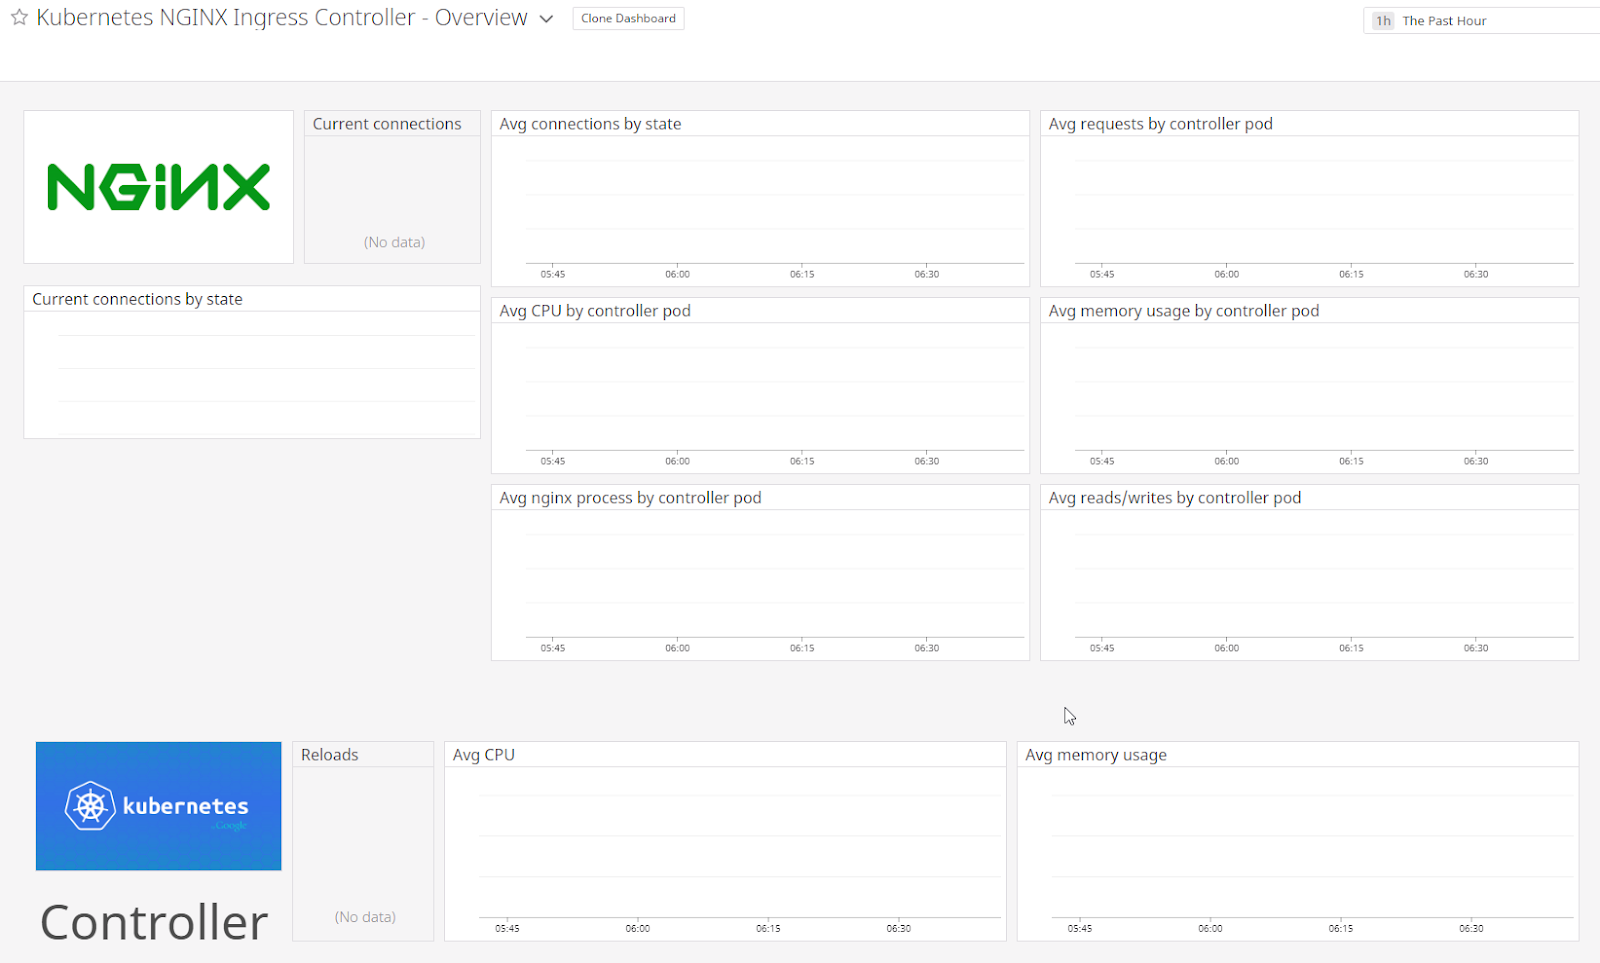
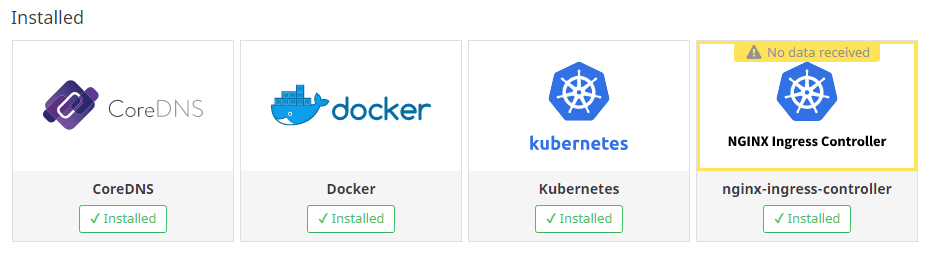
Not all dashboards were useful. The NGinx dashboard (and likely it’s a configuration issue) clearly wasn’t watching the ingress controllers i had launched in ingress-basic’s namespace.
I even tried murdering the pods and still no data showed up:
builder@DESKTOP-JBA79RT:~$ kubectl delete pod nginx-ingress-controller-5c64f4c5d4-28xc8 -n ingress-basic && kubectl delete pod nginx-ingress-controller-5c64f4c5d4-8nw5s -n ingress-basic && kubectl delete pod nginx-ingress-default-backend-76b8f499cb-6jflx -n ingress-basic
pod "nginx-ingress-controller-5c64f4c5d4-28xc8" deleted
pod "nginx-ingress-controller-5c64f4c5d4-8nw5s" deleted
pod "nginx-ingress-default-backend-76b8f499cb-6jflx" deleted
And the dashboard picker confirmed that suspicion
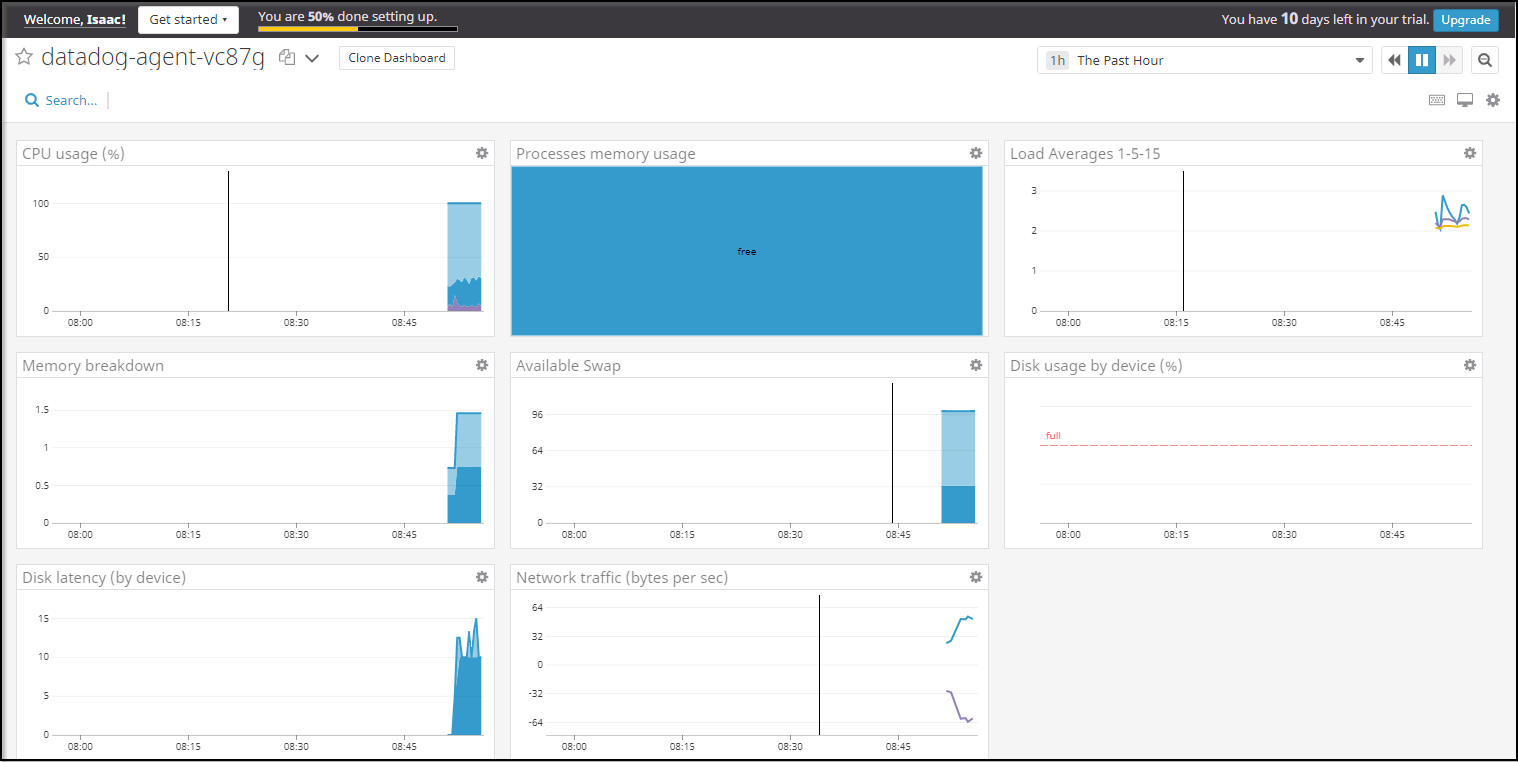
Let’s revisit the Infra dashboard
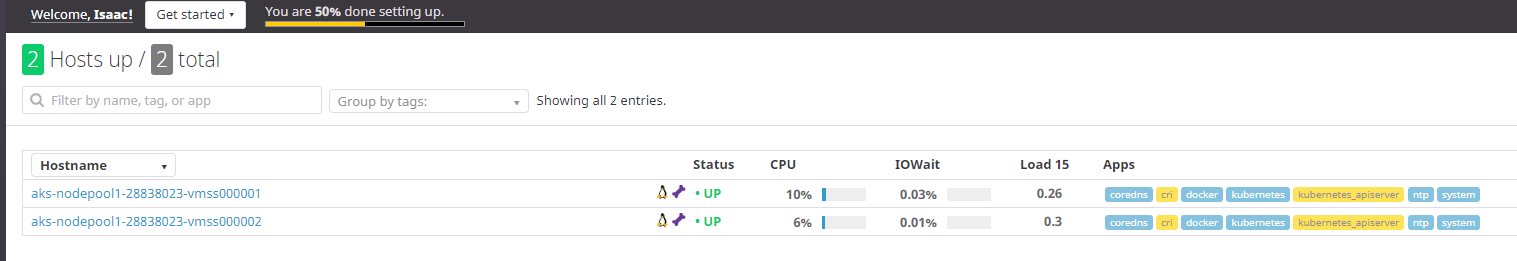
We can pick a node and look at metrics over time:
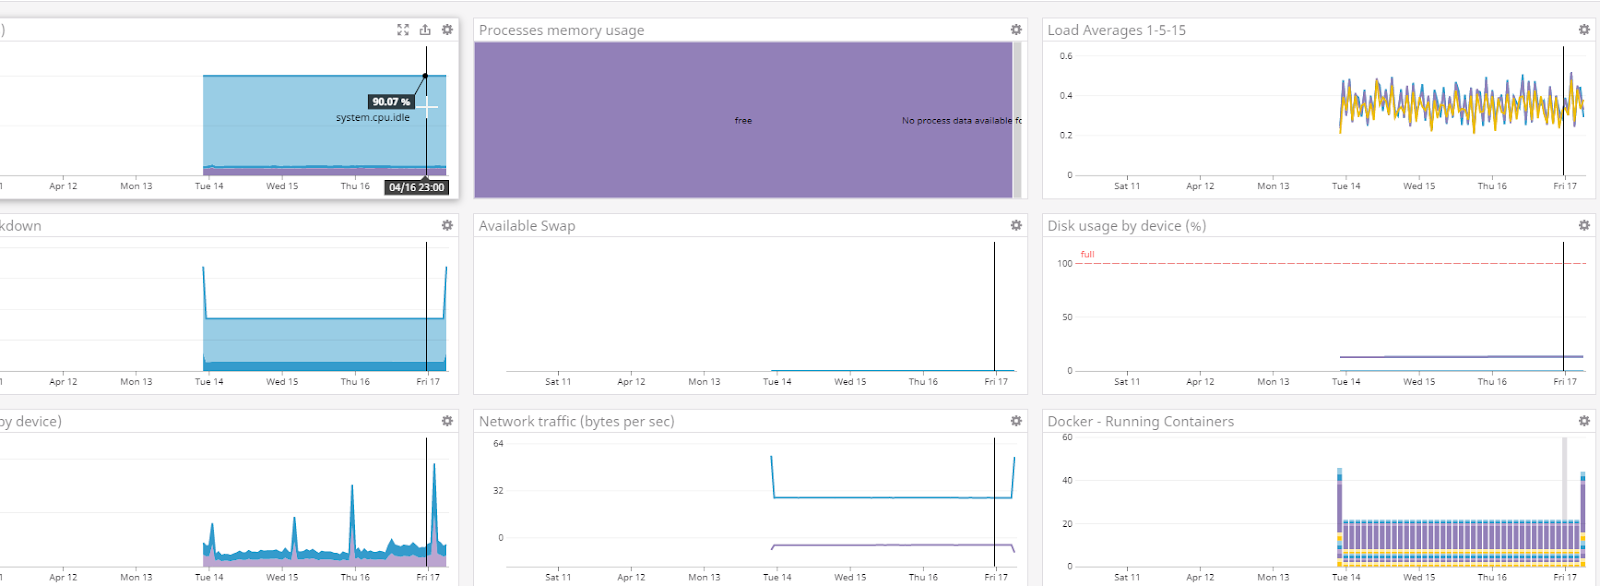
We can see the largest space in processes (purple) is “free” and the CPU barely registers above 1%.
Cloud Integrations
Another way we can look at hour hosts is via Azure integrations. We can monitor the VMSS behind our cluster directly as well:
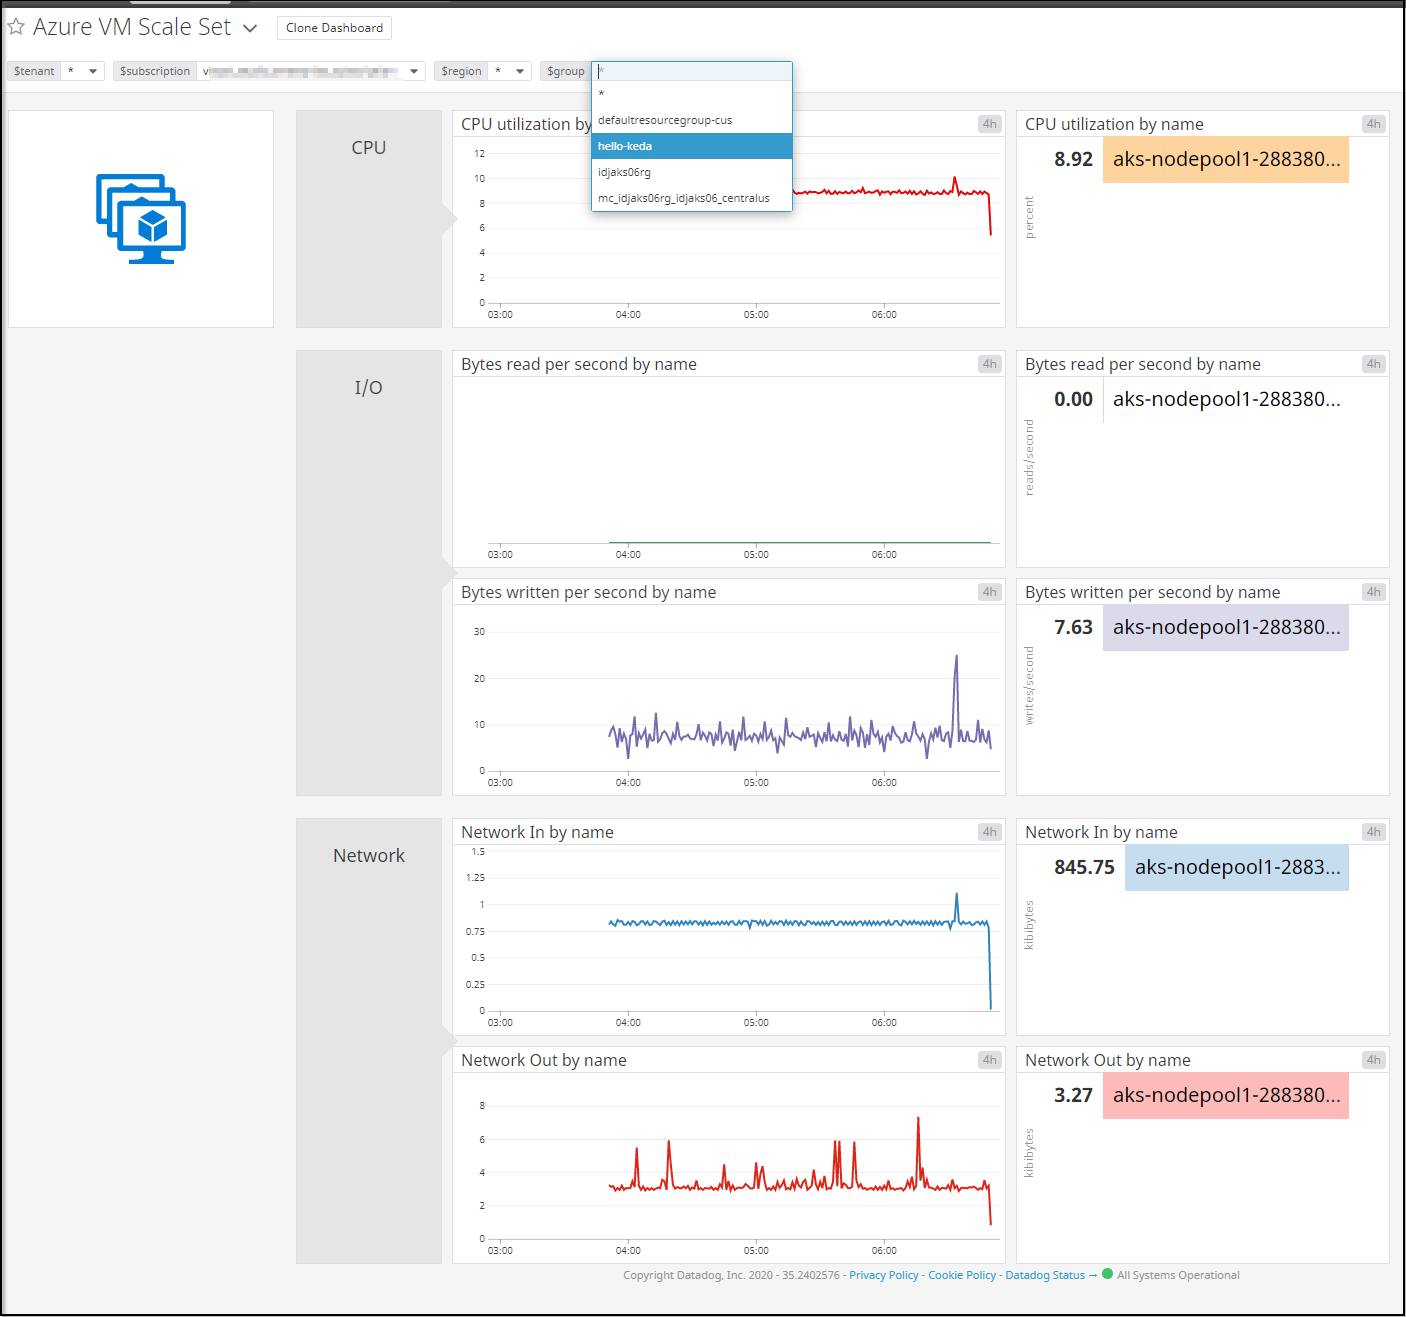
What we see above are the combined metrics over our entire VMSS as captured by DataDog.
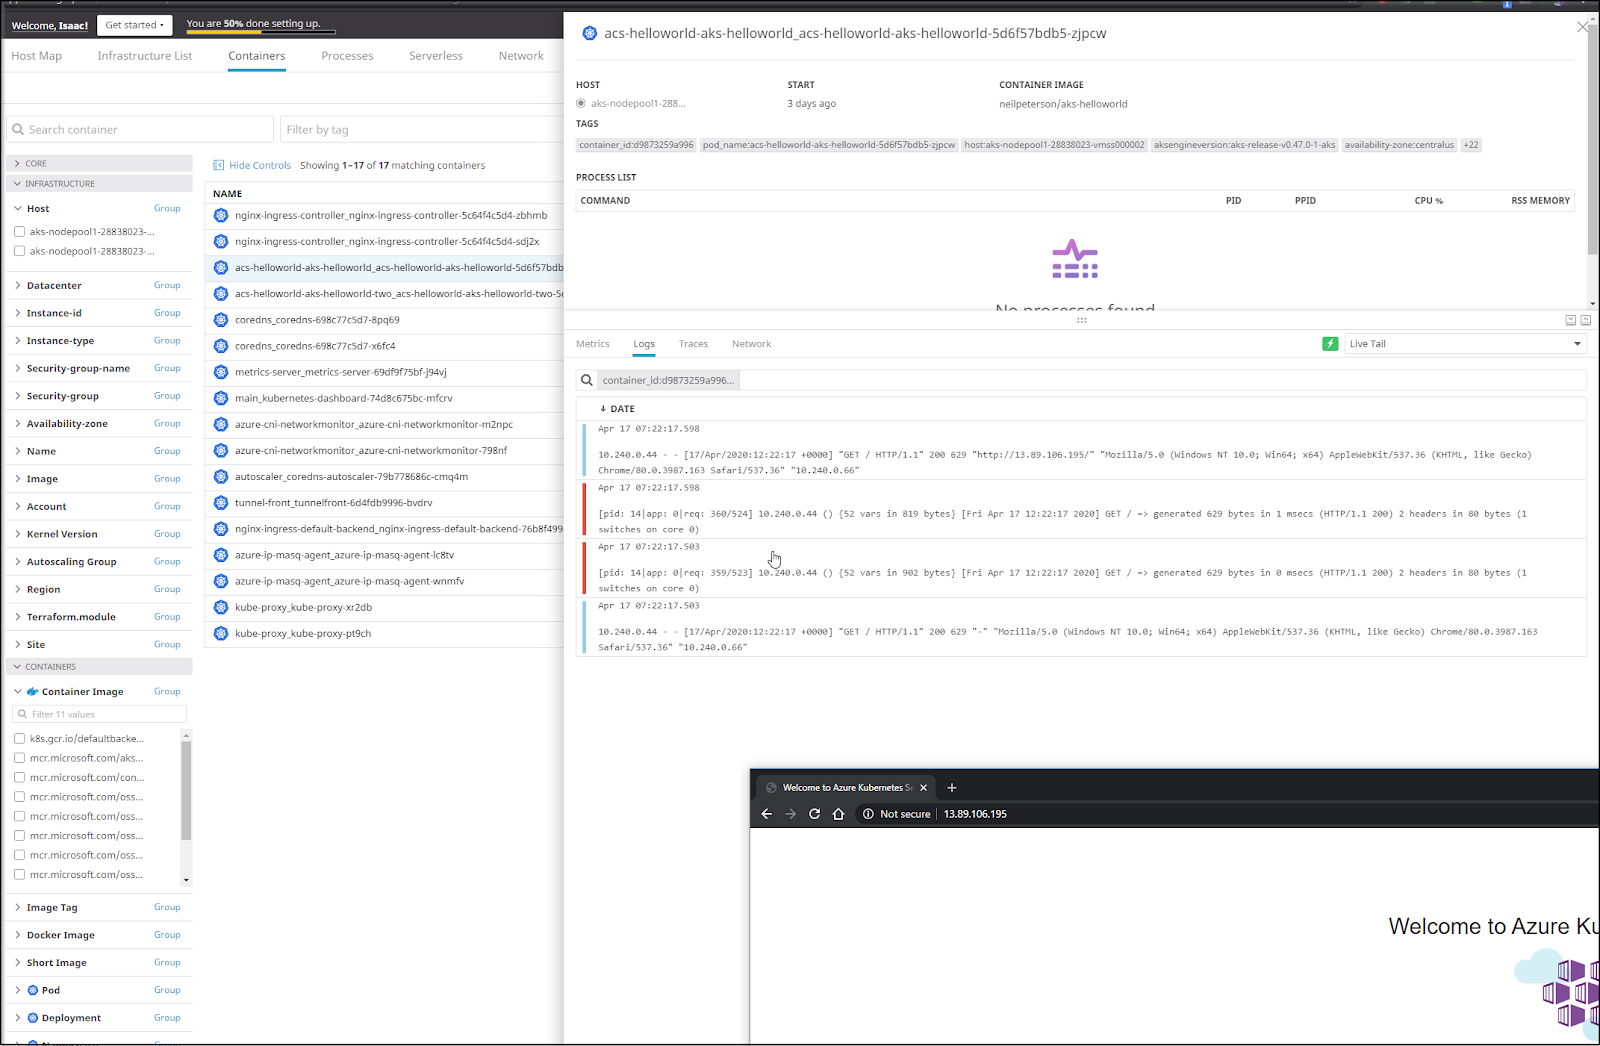
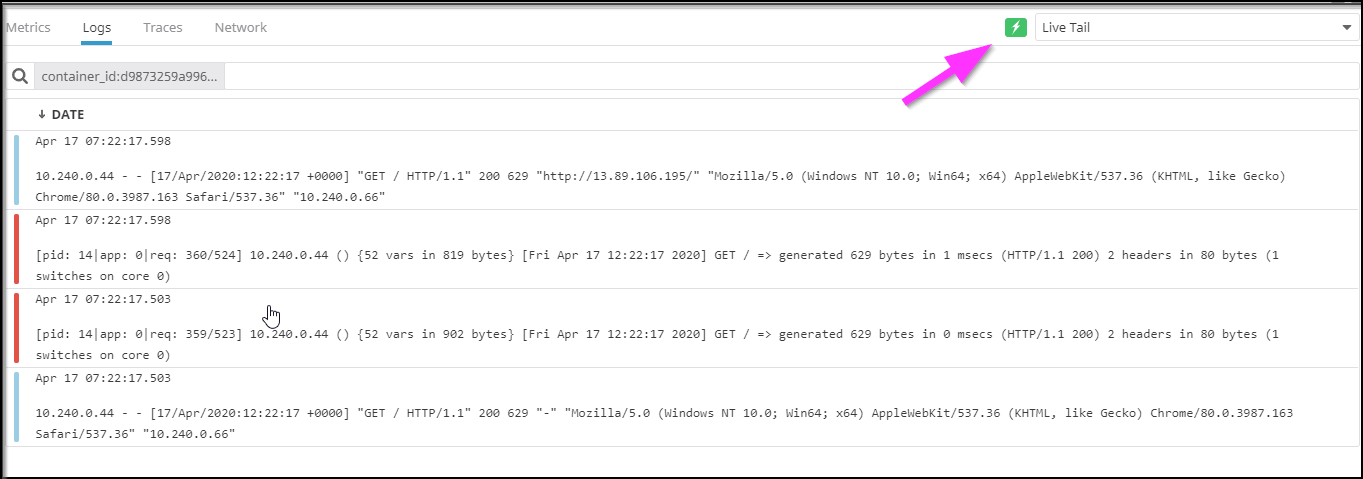
Another great feature is log capturing. One thing my user base often asks me for is to see the logs of their containers. Really what they want is to see a feed in their namespace while they do activities. We can watch a live feed on any container right in Datadog (no need for the k8s dashboard):
Monitor Azure DevOps
We can follow this guide to install hooks into our AzDO.
Let’s create a service connection in our project:
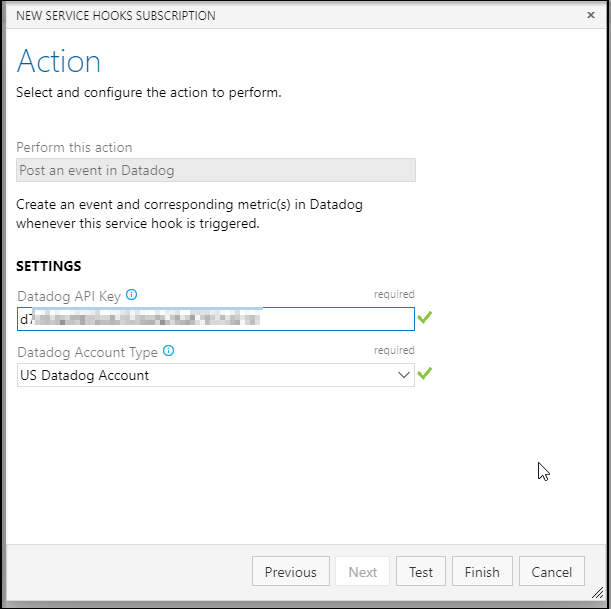
We can then click + to add and pick datadog:
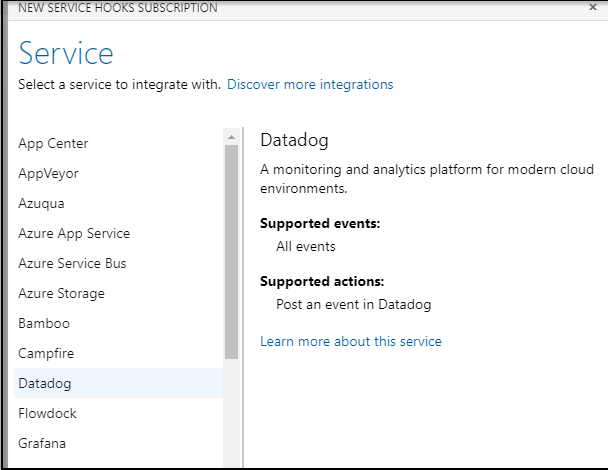
Let’s pick to update on PR updates:
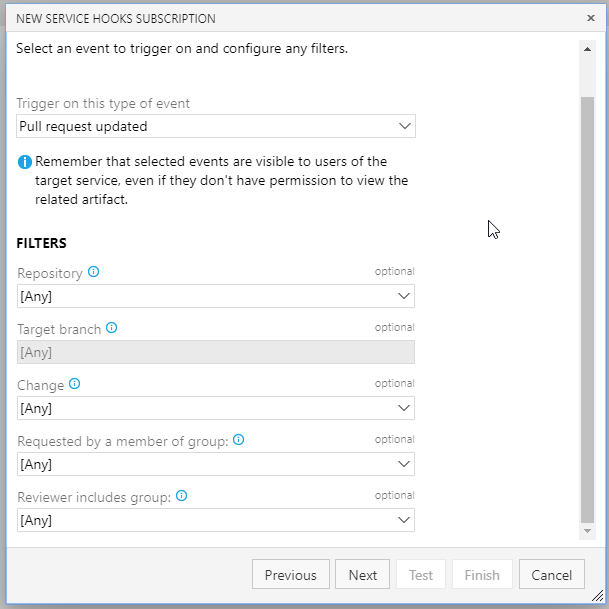
Then just enter your API key to test and add:
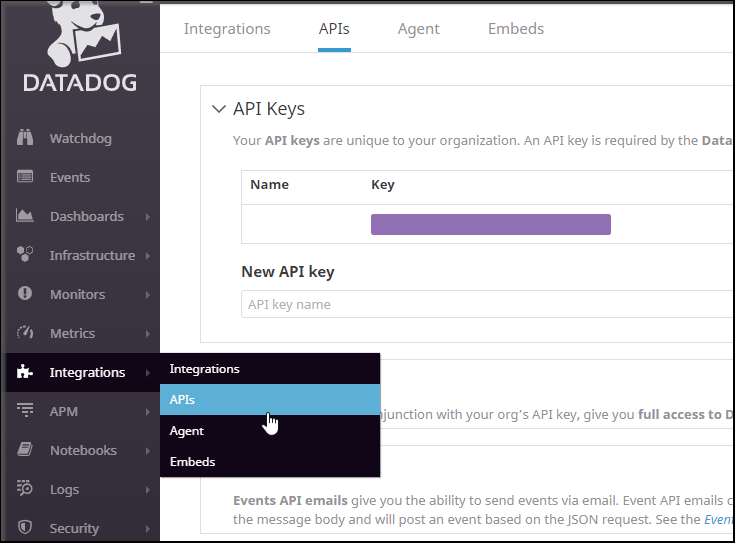
If you need to get your key, its under Integrations in DD:
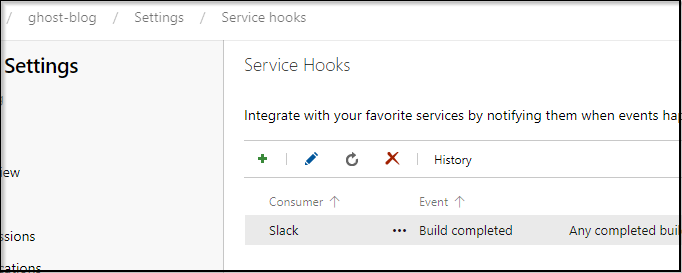
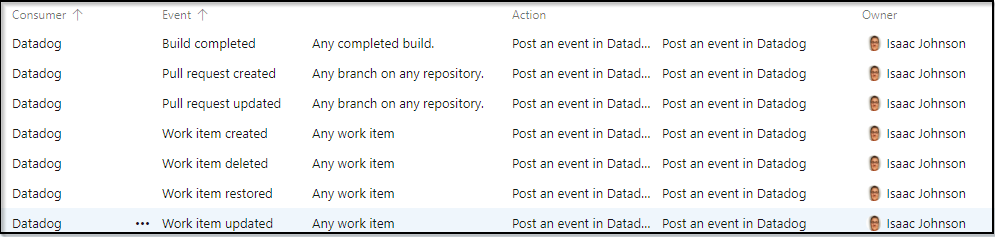
I added PR, Build and Work Item service hooks:
Let’s try it out. We can make a work item and assign it to ourselves:
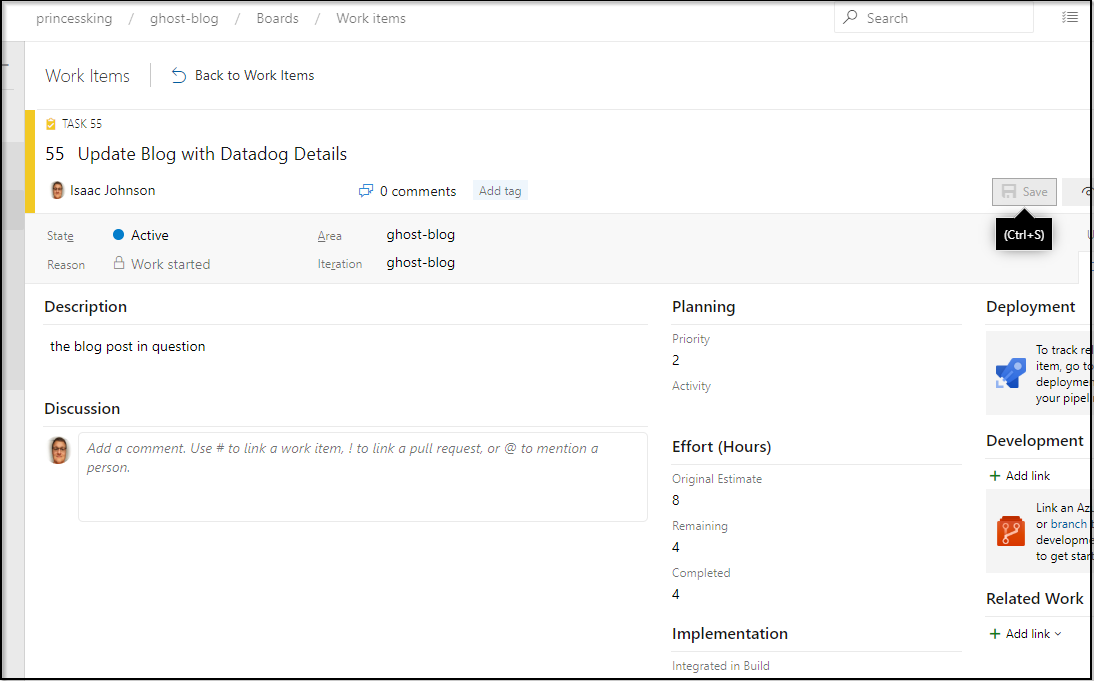
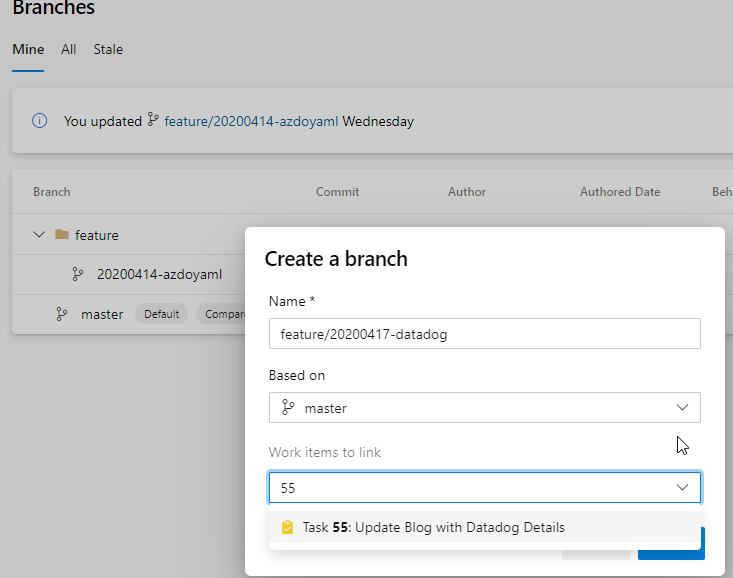
We can then make a meaningless change and test it:
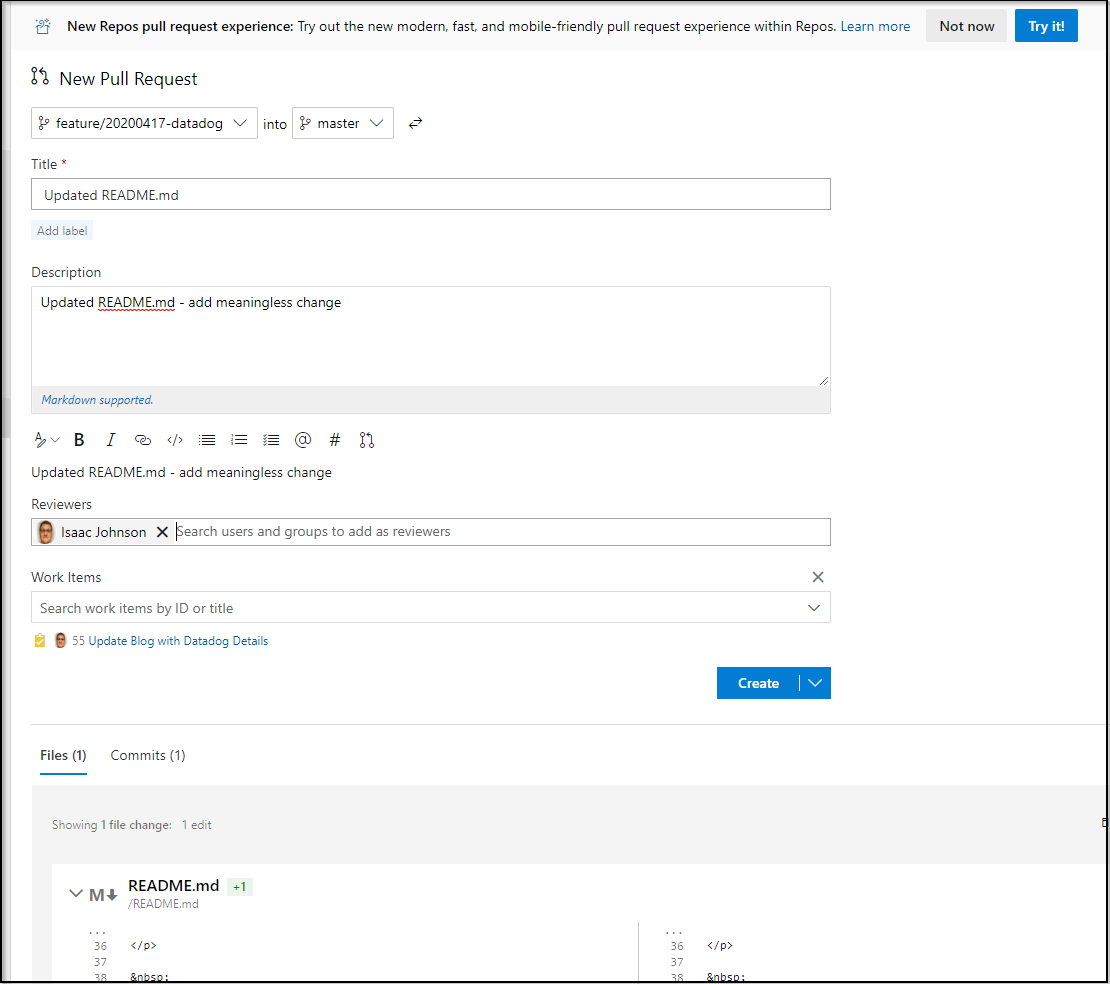
That will also trigger some builds:
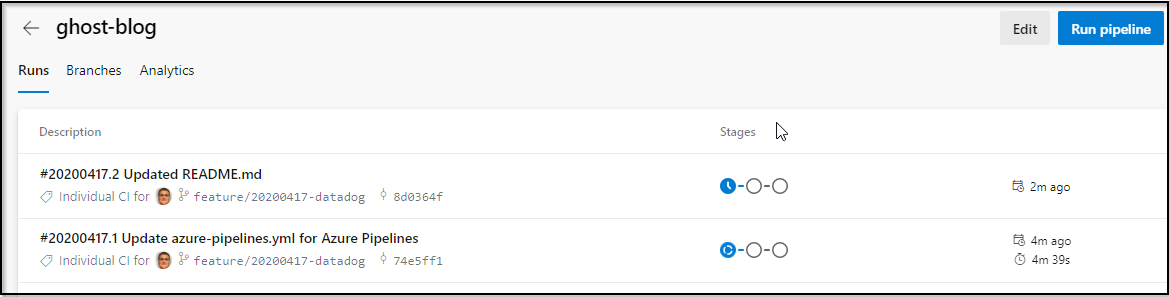
Right away we can see events being captured:
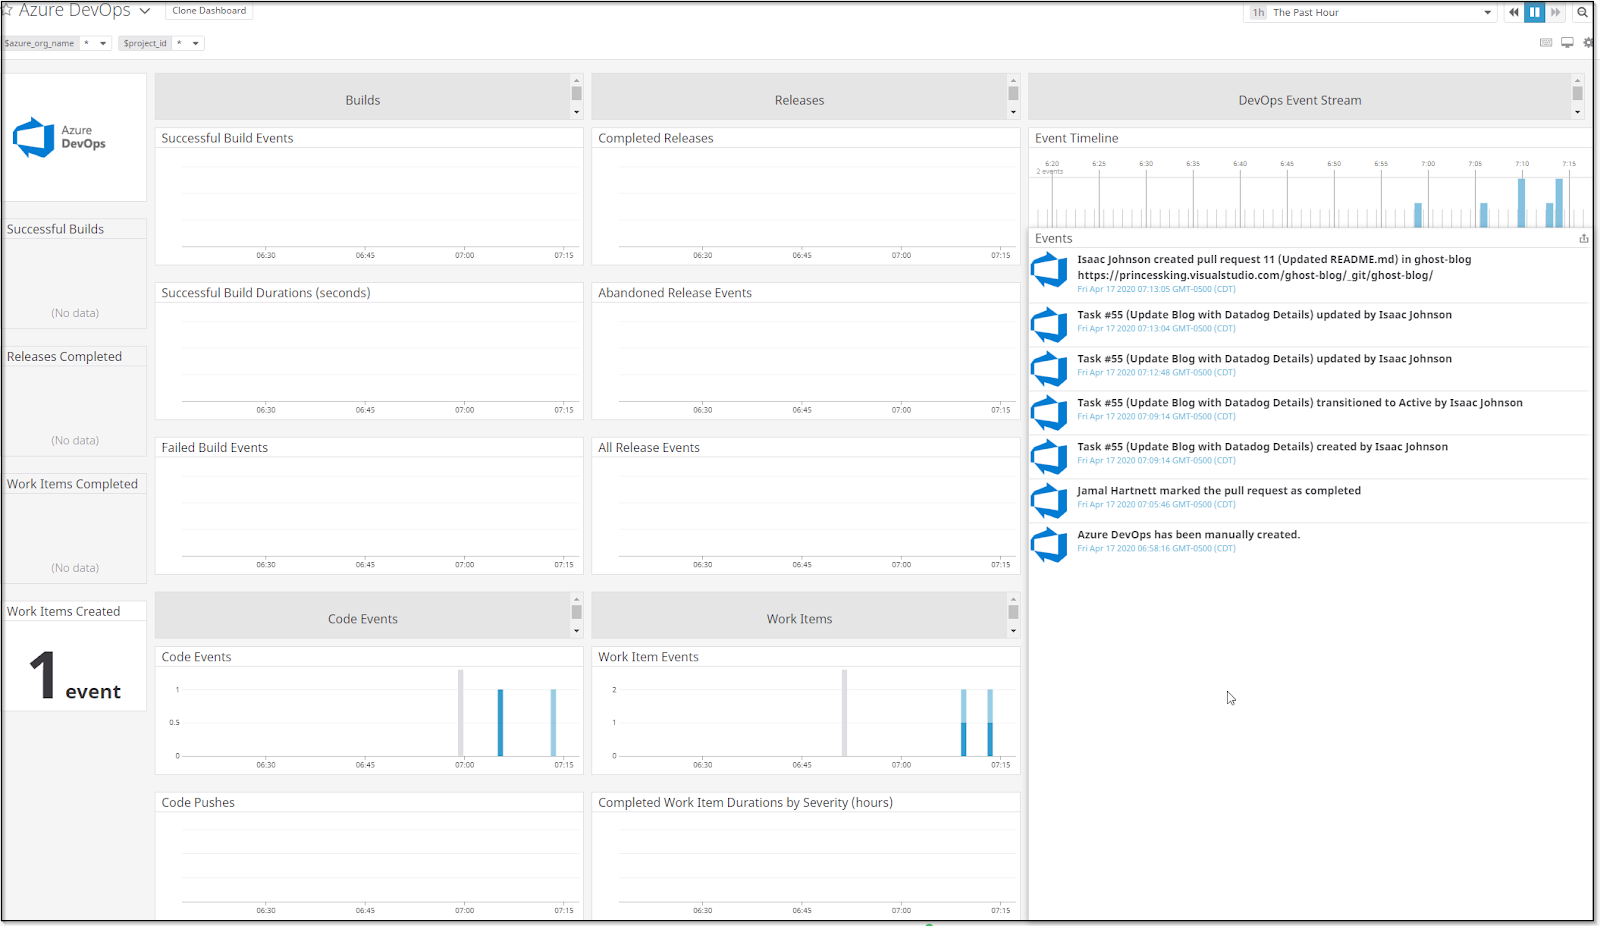
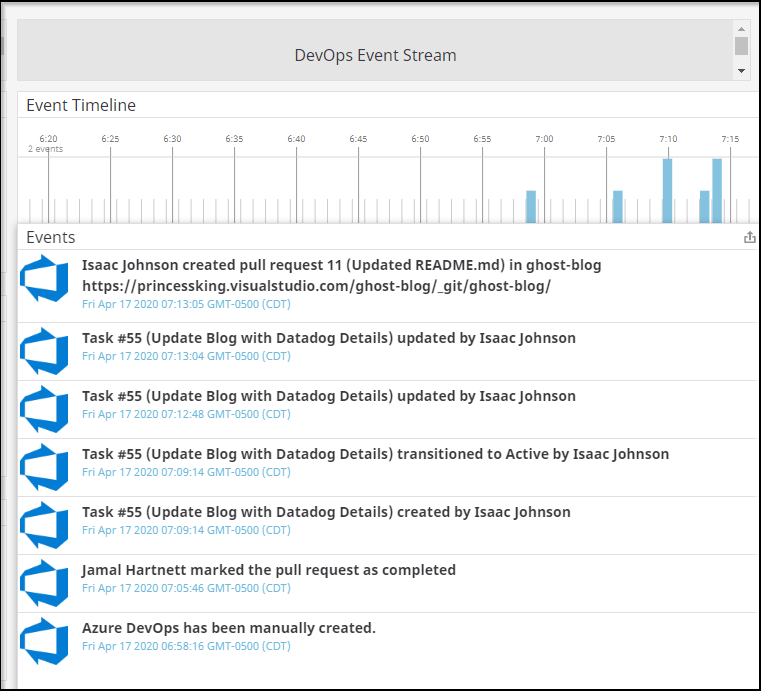
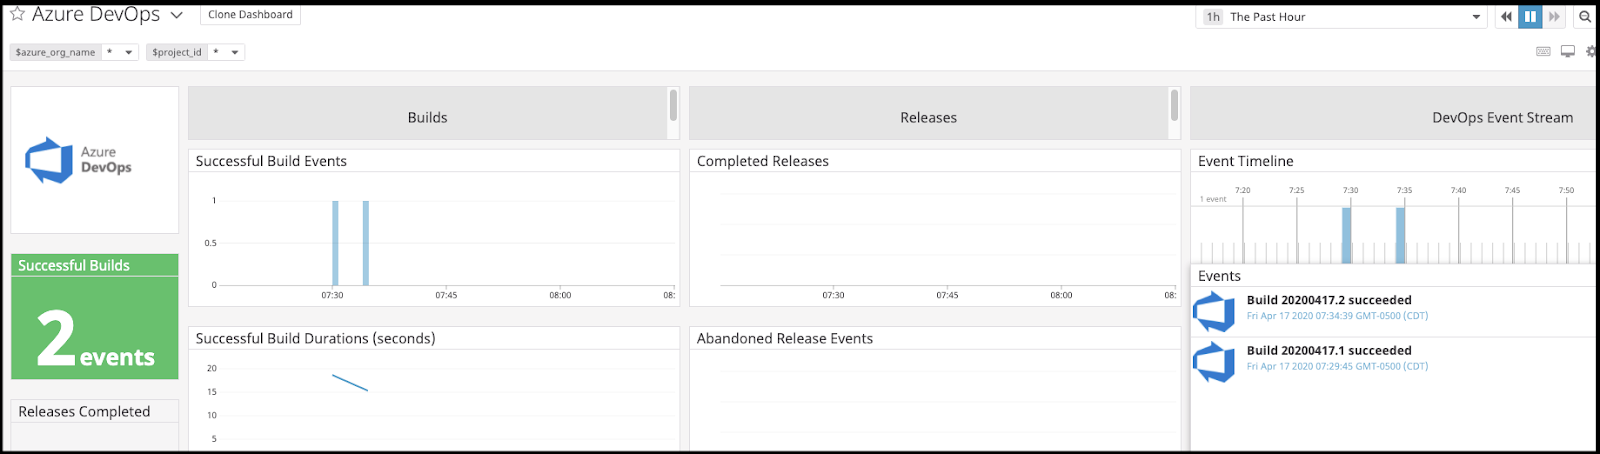
How about tracking of builds?
ARM
Let’s log into my local PI cluster:
pi@raspberrypi:~ $ kubectl get nodes
NAME          STATUS   ROLES    AGE    VERSION
retropie      Ready    <none>   81d    v1.17.2+k3s1
raspberrypi   Ready    master   237d   v1.17.2+k3s1
Apply the first set of YAMLs from the setup page.
Then we’ll need to use an ARM64 image from https://hub.docker.com/r/datadog/agent-arm64/tags
That means changing the default x64 container to an ARM based one:
      containers:
      - image: datadog/agent:7
to
      containers:
      - image: datadog/agent-arm64:7.19.0-rc.5
I also tweaked it based on this page to enable the network map.
However, on launch, i couldn’t schedule the pods due to insufficient memory:
Events:
  Type     Reason            Age        From               Message
  ----     ------            ----       ----               -------
  Warning  FailedScheduling  <unknown>  default-scheduler  0/2 nodes are available: 2 Insufficient memory.
  Warning  FailedScheduling  <unknown>  default-scheduler  0/2 nodes are available: 2 Insufficient memory.
I tried other agents as well.
The “official” arm64 gave me:
pi@raspberrypi:~ $ kubectl logs datadog-agent-ftpp8 -c datadog-agent
standard_init_linux.go:211: exec user process caused "exec format error"
Which usually means the wrong binary.
This one https://hub.docker.com/r/gridx/datadog-agent-arm32v7/tags gave me
  Warning  Failed     21m (x3 over 21m)    kubelet, raspberrypi  Error: failed to create containerd task: OCI runtime create failed: container_linux.go:346: starting container process caused "exec: \"/opt/datadog-agent/embedded/bin/system-probe\": stat /opt/datadog-agent/embedded/bin/system-probe: no such file or directory": unknown
  Warning  Unhealthy  20m (x3 over 21m)    kubelet, raspberrypi  Liveness probe failed: Get http://10.42.0.107:5555/health: dial tcp 10.42.0.107:5555: connect: connection refused
  Normal   Killing    20m                  kubelet, raspberrypi  Container datadog-agent failed liveness probe, will be restarted
I tried a different guide:
https://docs.datadoghq.com/agent/kubernetes/?tab=daemonset
And just changed the image:
      containers:
        - image: 'gridx/datadog-agent-arm32v7'
Alas, that failed as well
datadog-agent-mhl9c                                 0/1     CrashLoopBackOff   7          16m
datadog-agent-kfm6g                                 0/1     CrashLoopBackOff   7          16m
pi@raspberrypi:~ $ kubectl logs datadog-agent-mhl9c
No handlers could be found for logger "utils.dockerutil"
2020-04-18 13:41:27,594 CRIT Supervisor running as root (no user in config file)
2020-04-18 13:41:27,649 INFO RPC interface 'supervisor' initialized
2020-04-18 13:41:27,650 CRIT Server 'unix_http_server' running without any HTTP authentication checking
2020-04-18 13:41:27,651 INFO supervisord started with pid 1
2020-04-18 13:41:28,656 INFO spawned: 'dogstatsd' with pid 23
2020-04-18 13:41:28,661 INFO spawned: 'forwarder' with pid 24
2020-04-18 13:41:28,667 INFO spawned: 'collector' with pid 25
2020-04-18 13:41:28,678 INFO spawned: 'jmxfetch' with pid 26
2020-04-18 13:41:31,019 INFO success: collector entered RUNNING state, process has stayed up for > than 2 seconds (startsecs)
2020-04-18 13:41:31,919 INFO success: dogstatsd entered RUNNING state, process has stayed up for > than 3 seconds (startsecs)
2020-04-18 13:41:31,919 INFO success: forwarder entered RUNNING state, process has stayed up for > than 3 seconds (startsecs)
2020-04-18 13:41:31,923 INFO success: jmxfetch entered RUNNING state, process has stayed up for > than 3 seconds (startsecs)
2020-04-18 13:41:34,924 INFO exited: jmxfetch (exit status 0; expected)
2020-04-18 13:42:23,852 WARN received SIGTERM indicating exit request
2020-04-18 13:42:23,854 INFO waiting for dogstatsd, forwarder, collector to die
2020-04-18 13:42:24,005 INFO stopped: forwarder (exit status 0)
2020-04-18 13:42:24,013 INFO stopped: collector (exit status 0)
2020-04-18 13:42:24,047 INFO stopped: dogstatsd (exit status 0)
Worked
In the end, what did work was the vanilla yaml with the image change (note: image:)
pi@raspberrypi:~ $ cat datadog-agent-vanilla.yaml
apiVersion: apps/v1
kind: DaemonSet
metadata:
  name: datadog-agent
spec:
  selector:
    matchLabels:
      app: datadog-agent
  template:
    metadata:
      labels:
        app: datadog-agent
      name: datadog-agent
    spec:
      serviceAccountName: datadog-agent
      containers:
      - image: 'gridx/datadog-agent-arm32v7'
        imagePullPolicy: Always
        name: datadog-agent
        ports:
          - containerPort: 8125
            # Custom metrics via DogStatsD - uncomment this section to enable custom metrics collection
            # hostPort: 8125
            name: dogstatsdport
            protocol: UDP
          - containerPort: 8126
            # Trace Collection (APM) - uncomment this section to enable APM
            # hostPort: 8126
            name: traceport
            protocol: TCP
        env:
          - name: DD_API_KEY
            valueFrom:
              secretKeyRef:
                name: datadog-secret
                key: api-key
          - name: DD_COLLECT_KUBERNETES_EVENTS
            value: "true"
          - name: DD_LEADER_ELECTION
            value: "true"
          - name: KUBERNETES
            value: "true"
          - name: DD_HEALTH_PORT
            value: "5555"
          - name: DD_KUBERNETES_KUBELET_HOST
            valueFrom:
              fieldRef:
                fieldPath: status.hostIP

          ## For secure communication with the Cluster Agent (required to use the Cluster Agent)
          # - name: DD_CLUSTER_AGENT_AUTH_TOKEN
          #
          ## If using a simple env var uncomment this section
          #
          #   value: <THIRTY_2_CHARACTERS_LONG_TOKEN>
          #
          ## If using a secret uncomment this section
          #
          #   valueFrom:
          #     secretKeyRef:
          #       name: datadog-auth-token
          #       key: token

        ## Note these are the minimum suggested values for requests and limits.
        ## The amount of resources required by the Agent varies depending on:
        ## * The number of checks
        ## * The number of integrations enabled
        ## * The number of features enabled
        resources:
          requests:
            memory: "256Mi"
            cpu: "200m"
          limits:
            memory: "256Mi"
            cpu: "200m"
        volumeMounts:
          - name: dockersocket
            mountPath: /var/run/docker.sock
          - name: procdir
            mountPath: /host/proc
            readOnly: true
          - name: cgroups
            mountPath: /host/sys/fs/cgroup
            readOnly: true
        livenessProbe:
          httpGet:
            path: /health
            port: 5555
          initialDelaySeconds: 15
          periodSeconds: 15
          timeoutSeconds: 5
          successThreshold: 1
          failureThreshold: 3
      volumes:
        - hostPath:
            path: /var/run/docker.sock
          name: dockersocket
        - hostPath:
            path: /proc
          name: procdir
        - hostPath:
            path: /sys/fs/cgroup
          name: cgroups
Now one issue I found myself having was that I now had a mix of Pi cluster nodes and AKS in my dashboard:
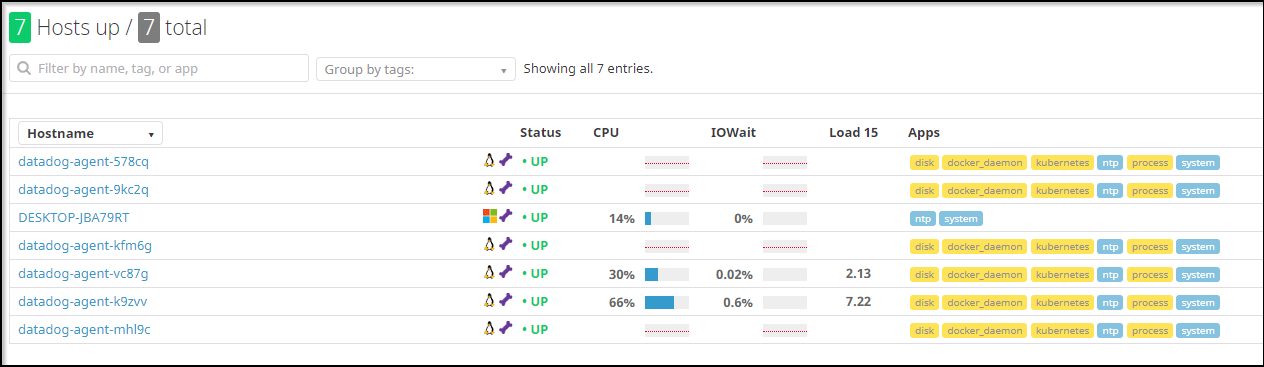
I wanted to tag resources in a reliable way so i could distinguish.
I added a block to the “env” section of the yaml:
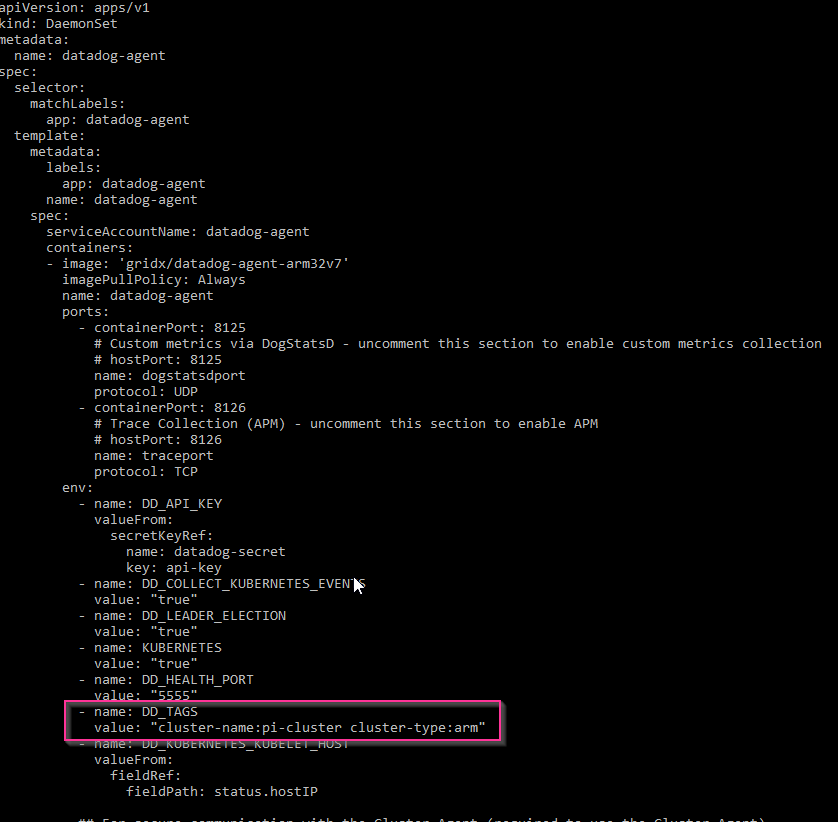
   - name: DD_TAGS
            value: "cluster-name:pi-cluster cluster-type:arm"
Then I did an apply
pi@raspberrypi:~ $ vi datadog-agent-vanilla.yaml
pi@raspberrypi:~ $ kubectl apply -f datadog-agent-vanilla.yaml
daemonset.apps/datadog-agent configured
The pods recycled:
pi@raspberrypi:~ $ kubectl get pods
NAME                                                READY   STATUS             RESTARTS   AGE
svclb-nginxingress-nginx-ingress-controller-x6chs   0/2     Pending            0          81d
nginxingress-nginx-ingress-controller-v8ck9         0/1     Pending            0          82d
svclb-nginxingress-nginx-ingress-controller-v9rht   2/2     Running            12         81d
nginxingress-nginx-ingress-controller-sd24n         0/1     CrashLoopBackOff   22924      81d
datadog-agent-tf5tw                                 1/1     Running            3          3m56s
datadog-agent-q6ffk                                 1/1     Running            3          3m49s
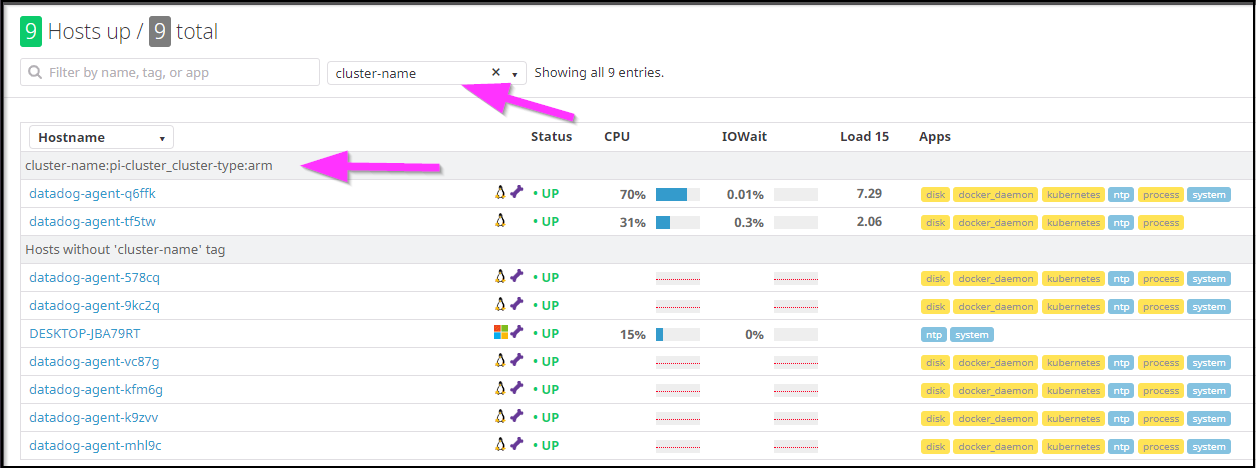
And now we can filter on cluster-name:
I did try an enable container tracing following the steps here: https://docs.datadoghq.com/infrastructure/livecontainers/?tab=kubernetes
However the pods started to crash:
datadog-agent-gzx58                                 0/1     CrashLoopBackOff   7          14m
datadog-agent-swmt4                                 0/1     CrashLoopBackOff   7          14m
pi@raspberrypi:~ $ kubectl describe pod datadog-agent-gzx58 | tail -n 5
  Normal   Started    14m (x3 over 16m)   kubelet, retropie  Started container datadog-agent
  Normal   Killing    13m (x3 over 15m)   kubelet, retropie  Container datadog-agent failed liveness probe, will be restarted
  Normal   Pulling    13m (x4 over 16m)   kubelet, retropie  Pulling image "gridx/datadog-agent-arm32v7"
  Warning  Unhealthy  10m (x16 over 15m)  kubelet, retropie  Liveness probe failed: Get http://10.42.1.26:5555/health: dial tcp 10.42.1.26:5555: connect: connection refused
  Warning  BackOff    67s (x37 over 10m)  kubelet, retropie  Back-off restarting failed container
pi@raspberrypi:~ $ kubectl logs datadog-agent-gzx58 -c datadog-agent
No handlers could be found for logger "utils.dockerutil"
2020-04-18 14:23:42,119 CRIT Supervisor running as root (no user in config file)
2020-04-18 14:23:42,180 INFO RPC interface 'supervisor' initialized
2020-04-18 14:23:42,181 CRIT Server 'unix_http_server' running without any HTTP authentication checking
2020-04-18 14:23:42,182 INFO supervisord started with pid 1
2020-04-18 14:23:43,186 INFO spawned: 'dogstatsd' with pid 25
2020-04-18 14:23:43,193 INFO spawned: 'forwarder' with pid 26
2020-04-18 14:23:43,199 INFO spawned: 'collector' with pid 27
2020-04-18 14:23:43,214 INFO spawned: 'jmxfetch' with pid 28
2020-04-18 14:23:45,219 INFO success: collector entered RUNNING state, process has stayed up for > than 2 seconds (startsecs)
2020-04-18 14:23:46,302 INFO success: dogstatsd entered RUNNING state, process has stayed up for > than 3 seconds (startsecs)
2020-04-18 14:23:46,302 INFO success: forwarder entered RUNNING state, process has stayed up for > than 3 seconds (startsecs)
2020-04-18 14:23:46,304 INFO success: jmxfetch entered RUNNING state, process has stayed up for > than 3 seconds (startsecs)
2020-04-18 14:23:49,888 INFO exited: jmxfetch (exit status 0; expected)
2020-04-18 14:24:33,713 WARN received SIGTERM indicating exit request
2020-04-18 14:24:33,714 INFO waiting for dogstatsd, forwarder, collector to die
2020-04-18 14:24:33,839 INFO stopped: forwarder (exit status 0)
2020-04-18 14:24:33,861 INFO stopped: collector (exit status 0)
2020-04-18 14:24:33,956 INFO stopped: dogstatsd (exit status 0)
I also tried the JMX image , but that is one large container (over 220mb) so it took my wee pi cluster a few and did not work:
pi@raspberrypi:~ $ kubectl logs datadog-agent-jtr7w
standard_init_linux.go:211: exec user process caused "exec format error"
I tried a few more containers i thought might be a current arm32 image such as careof/datadog-agent. That worked to spin agent, but did not collect container info, just metrics, possibly due to it's version
# ./agent version
Agent 6.14.1 - Commit: fa227f0 - Serialization version: 4.12.0 - Go version: go1.13.1
I could move onto building from source myself but I didn’t want to take it that far (yet).
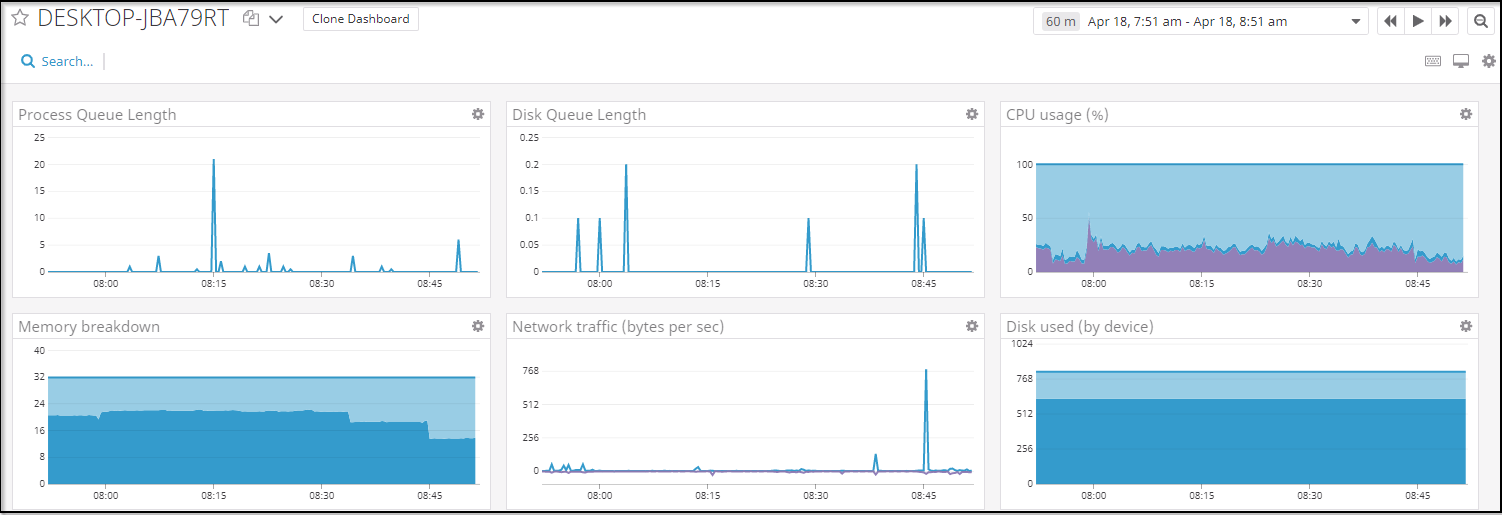
Monitoring Windows
I applied the Datadog agent to my desktop.
It runs in the system tray:
And we can see it collects some basic details:
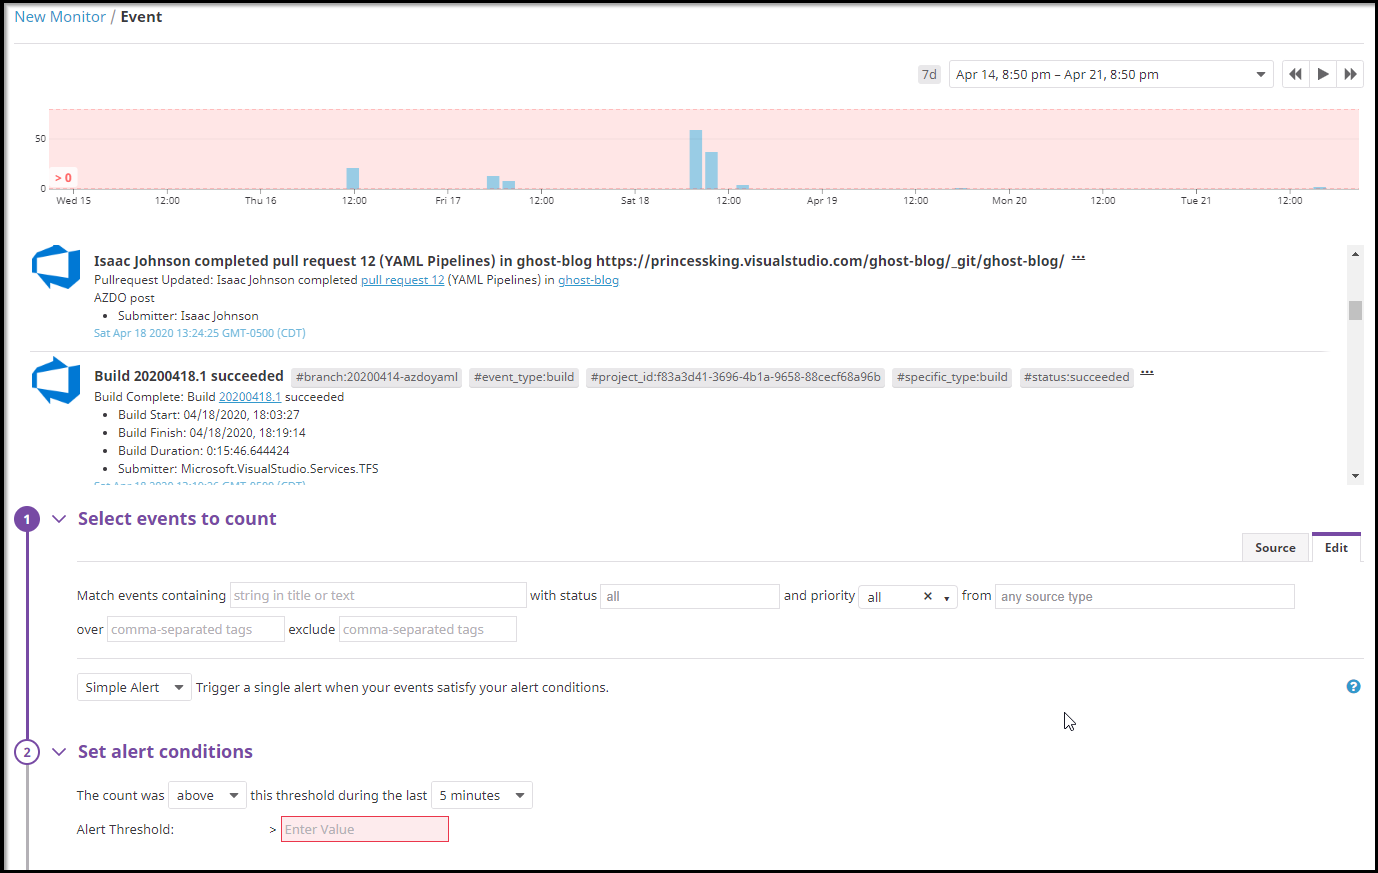
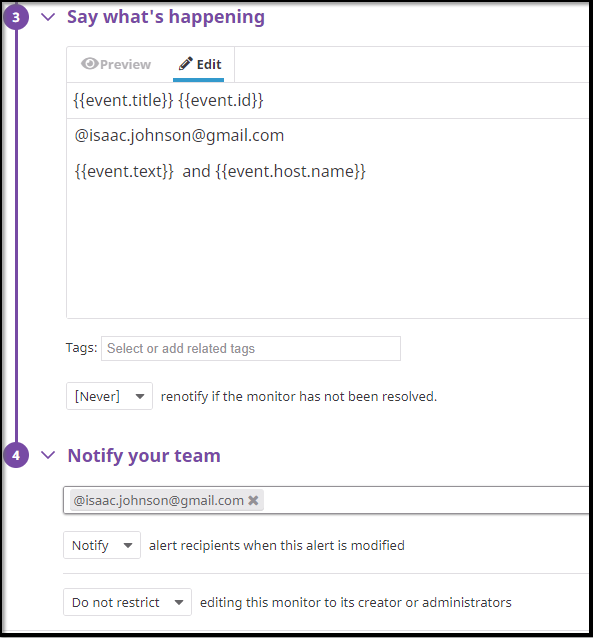
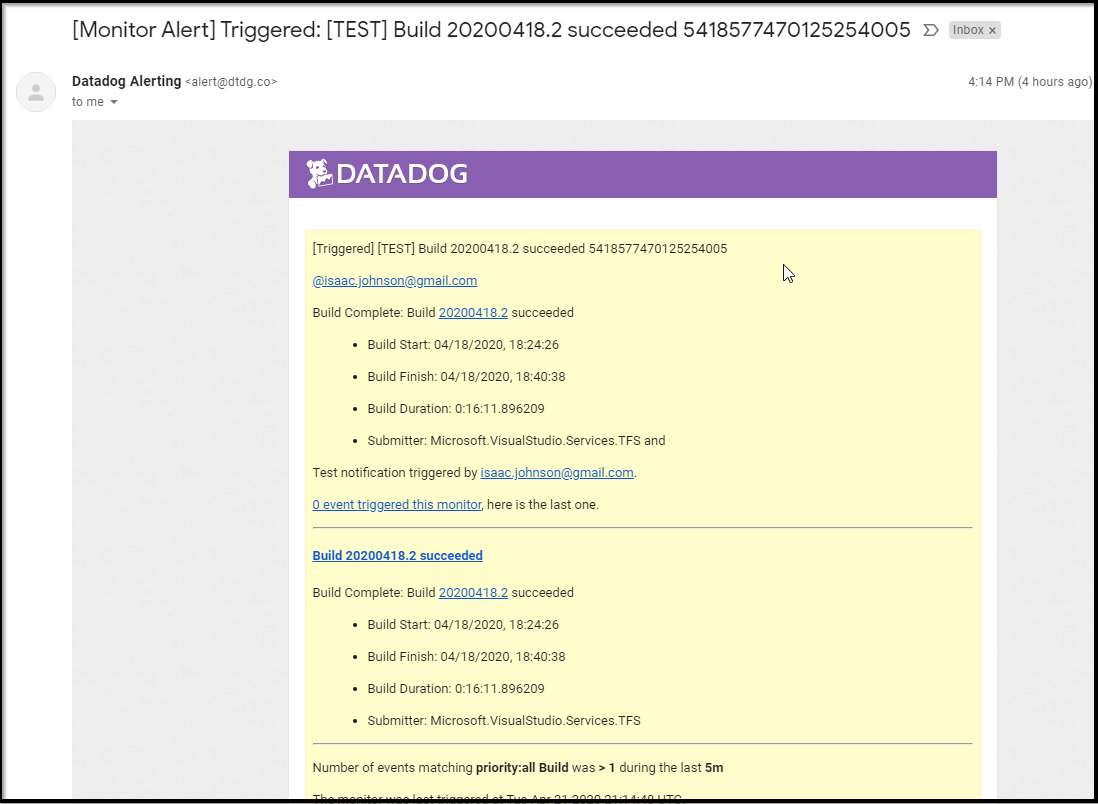
Alerting.
We can define monitors on any metric and then set alerts that send emails.
For instance we can monitor events tracked by Azure DevOps:
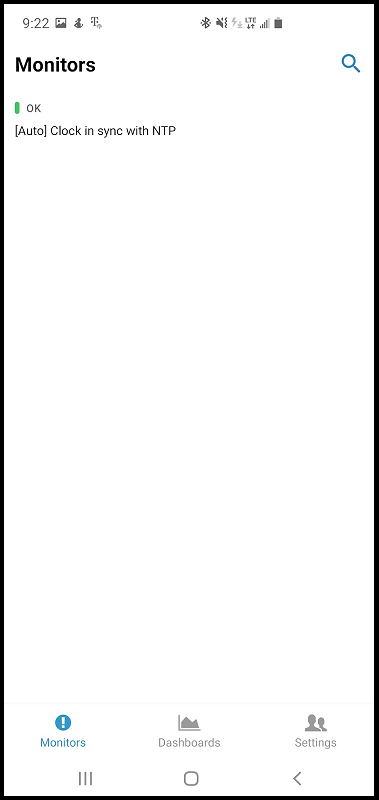
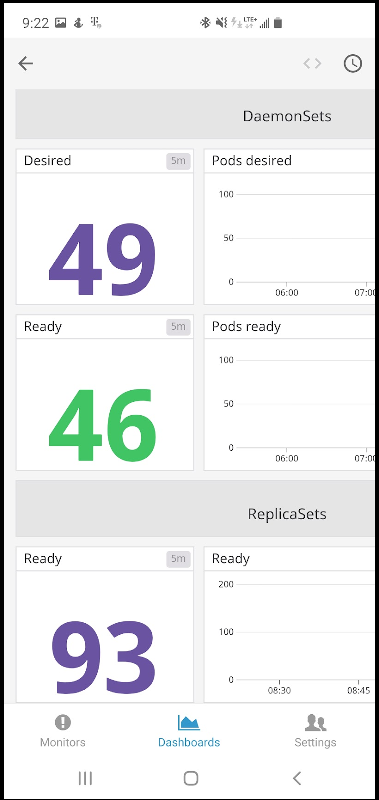
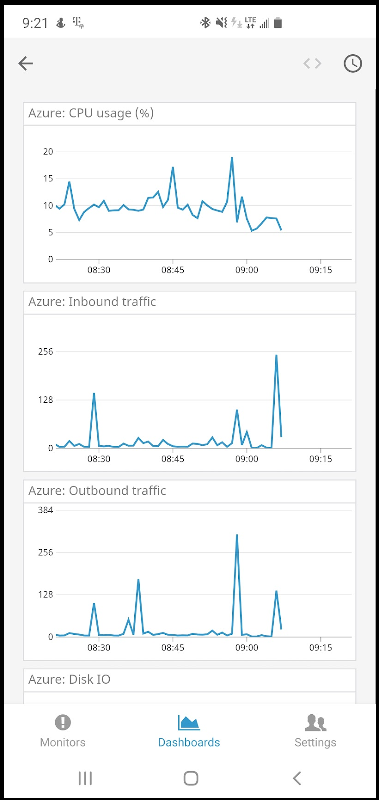
Summary
Datadog is a seasoned player. They have a myriad of integrations, we barely touched the surface. Of the APM / ALM tools I’ve looked at thus far, they are the first to have a solid app for mobile as well: